167 values today, 24 recorded gaps, and every value checkable in about a minute, by a human or an agent.
If you are trying to understand debt dynamics in developing countries and you are not paying attention to currency, you are missing a lot. The FX share decides whether a depreciation is a nuisance or a solvency event. For any one country, people who do this work know where to look: the debt sustainability analysis (DSA) annex, the central bank bulletin, the finance ministry's quarterly debt report. The hard question is scale. How do you source a reasonable number for every country at once, and know what each one means?
We built that answer and released it open source. We aimed at the full roster the two DSA frameworks cover, 191 countries, and found a defensible value for 167 of them, read from each country's latest published DSA with the report URL, PDF hash, page, arithmetic, and definitional flags on every row. The 24 misses ship too, as recorded gaps with reasons, never guesses. The code and the data are published under permissive open source licenses, free for anyone to use. It renders in the table below, pins on GitHub, and powers the country defaults in our own debt projection tool.
residency-based proxies, flagged and capped at medium confidence
24
recorded gaps with reasons, never guesses
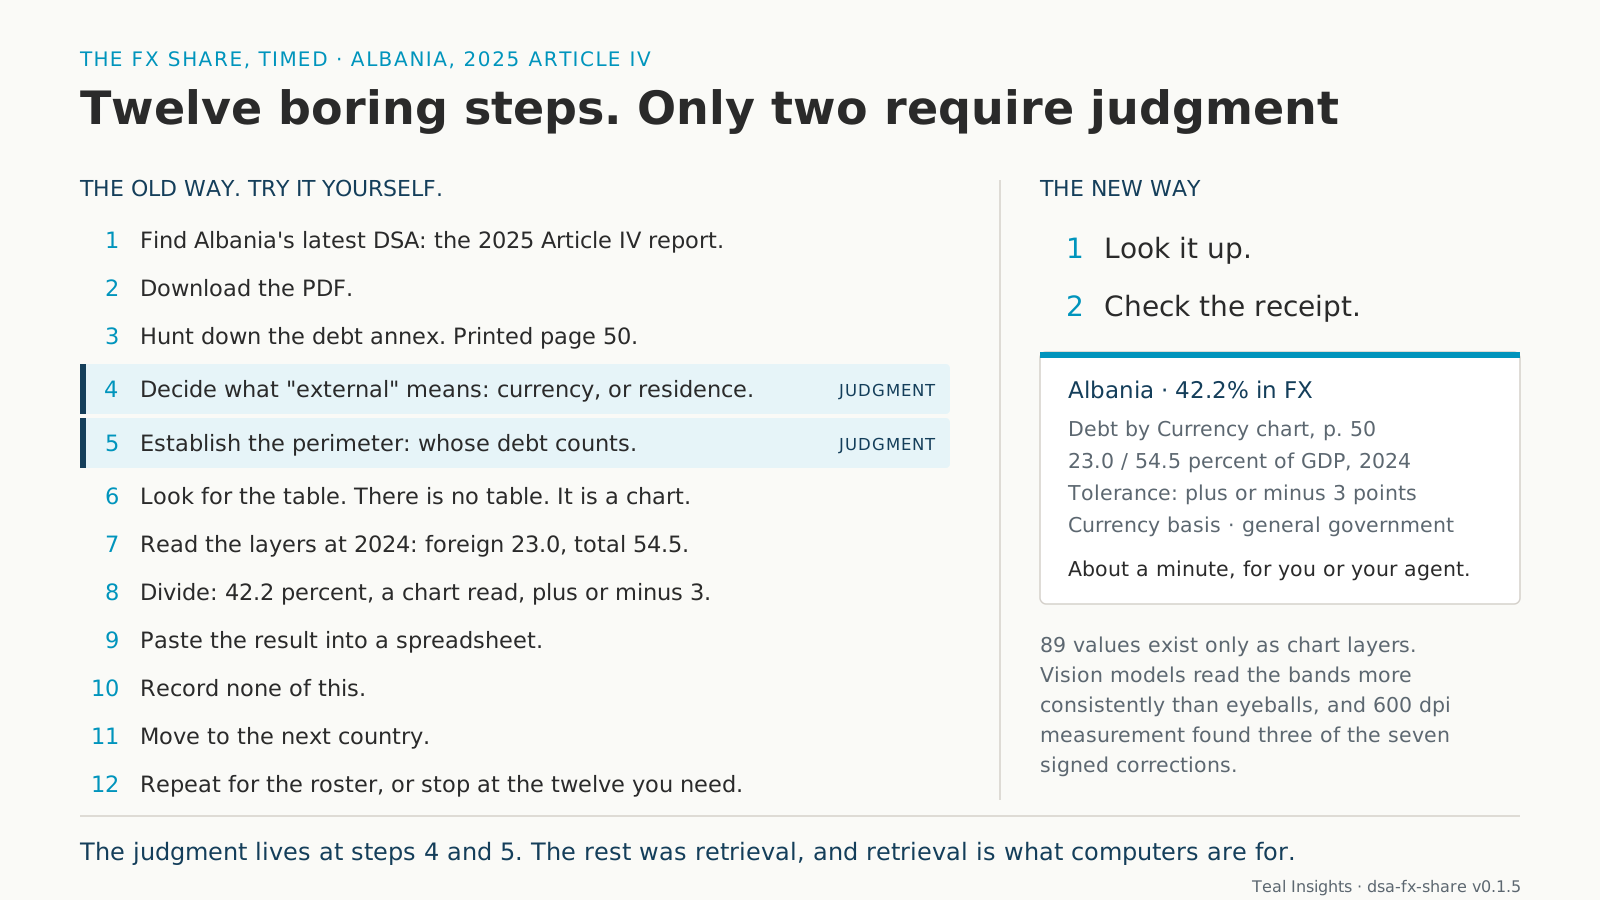
Twelve boring steps. Only two require judgment
A century ago Frederick Winslow Taylor, the original efficiency engineer, timed factory work motion by motion to find the few that mattered, and manufacturing left craft production behind. Most of our field still makes this number the craft way: learned from a colleague, rebuilt by hand, recorded nowhere. We argued in Clearing the Clogs that the cure for toil is to write things down to a standard a tool can carry. Here is that argument applied to one number, timed step by step for Albania, and you can replicate it as you read.
Steps 6 and 7 are also why this is more than OCR. For 89 of the values the number exists only as chart layers, and the traditional instrument for reading them is the human eyeball. Machines do this part better. A vision model reads band heights against a calibrated axis the same way every time, and deterministic measurement is better still: after two careful readers disagreed on three charts, re-measurement at 600 dpi settled all three, and those measurements became three of our seven signed corrections.
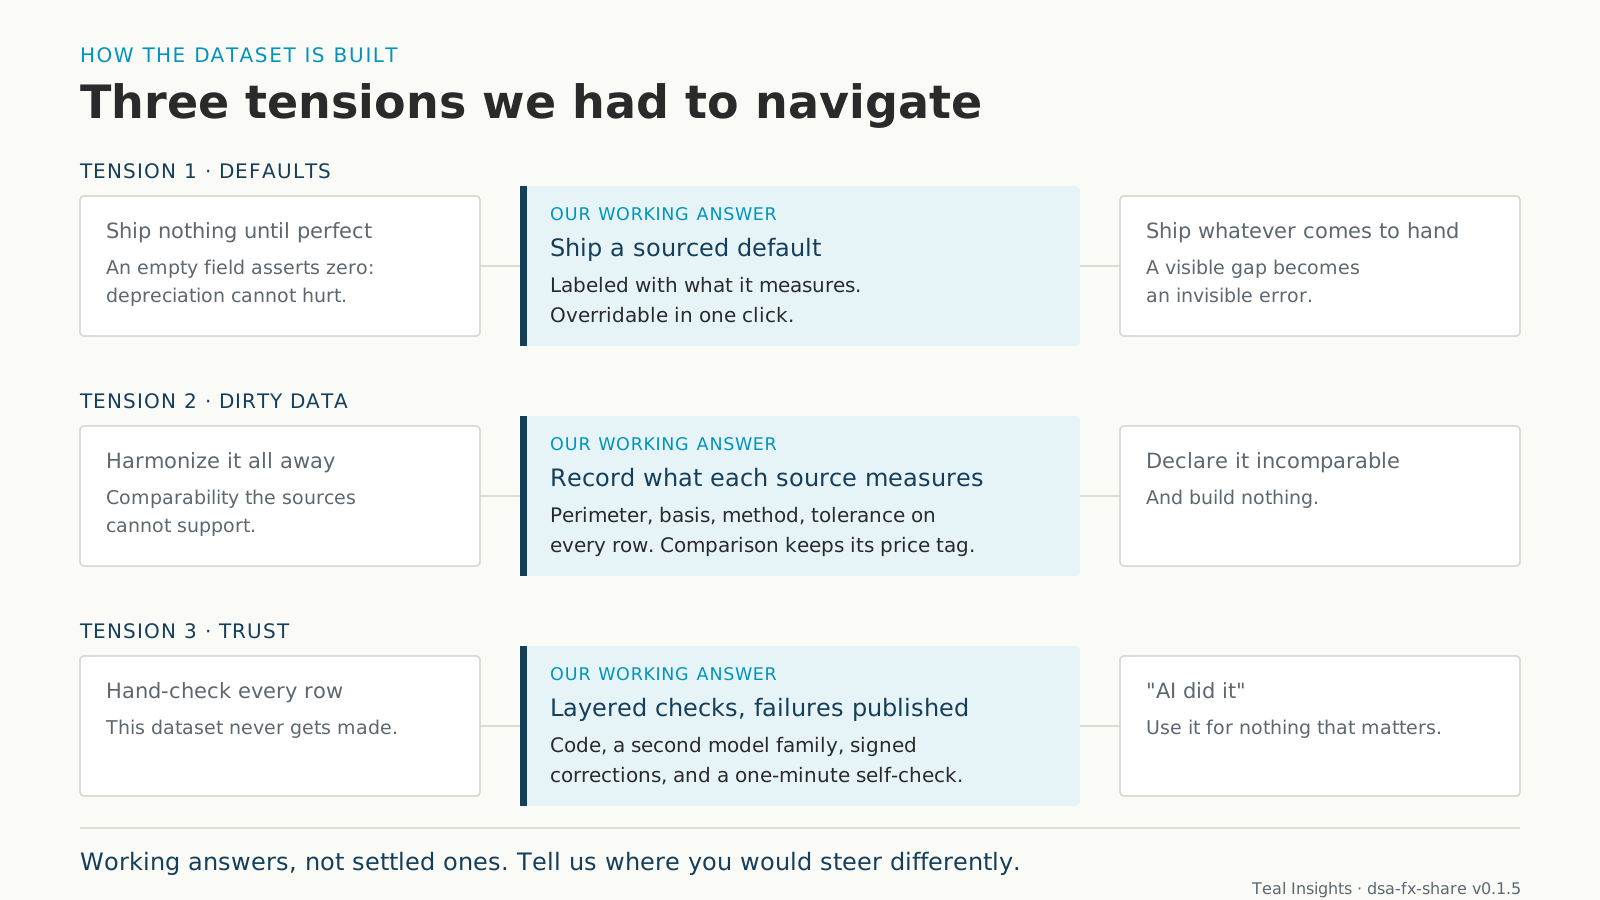
1 · Tools need reasonable defaults
A debt scenario needs a starting currency share, and there are two ways to fail it. Refuse to ship a number until the data is perfect, and you ship a zero anyway, because that is what an empty field asserts: depreciation cannot hurt. Or ship whatever number comes to hand, and you have swapped a visible gap for an invisible error. We take the road between: a sourced default for every country, labeled with what it measures, overridable in one click. A default invites lazy comparisons. We concede that, and answer it with the flags.
2 · The data is dirty, so we show our homework
It would be lovely if every country reported this share on one basis, inside one perimeter, in one table. That is not the world we live in. Perimeters run from central government to the nonfinancial public sector. "External" means currency in one report and creditor residence in the next. The number lives in a stacked chart as often as a table. Again two ways to fail: harmonize it all into one clean series, and you manufacture comparability the sources cannot support. Declare countries incomparable, and you build nothing. So each row records what its source measures: the perimeter and coverage flags, the basis (34 residency reads marked as explicit proxies), the method (89 chart reads with a stated plus-or-minus 3 point tolerance), and the derivation in prose. Comparison stays possible and its price stays visible. You decide what it is worth for your use.
3 · How do we know it is right?
Two more poles. Hand-check every row and this dataset never gets made. Wave at "AI did it" and you should not use it for anything that matters. Between them we run layered checks and publish the failures. Deterministic code recomputes every derivation on every release. A second AI model family followed the published directions across all 167 rows: 156 confirmed outright, every value it re-derived landed inside its stated tolerance, and the run still failed its own predeclared gates, mostly because ten advanced-economy zeros rest on charts their reports never state in words. That is in the validation report, with counts. A named human signs every correction: seven so far, three of them hours after our first publication, found by our own re-measurement. We shipped at lunch and corrected by dinner. The corrections policy is not a promise on a page. It has already run.
Our design choices navigate between these poles. They are working answers, and challenging them is the feedback we are asking for.
AI found the numbers, code checked the arithmetic, people decided the hard cases, and every row shows you how to check it yourself in about a minute.
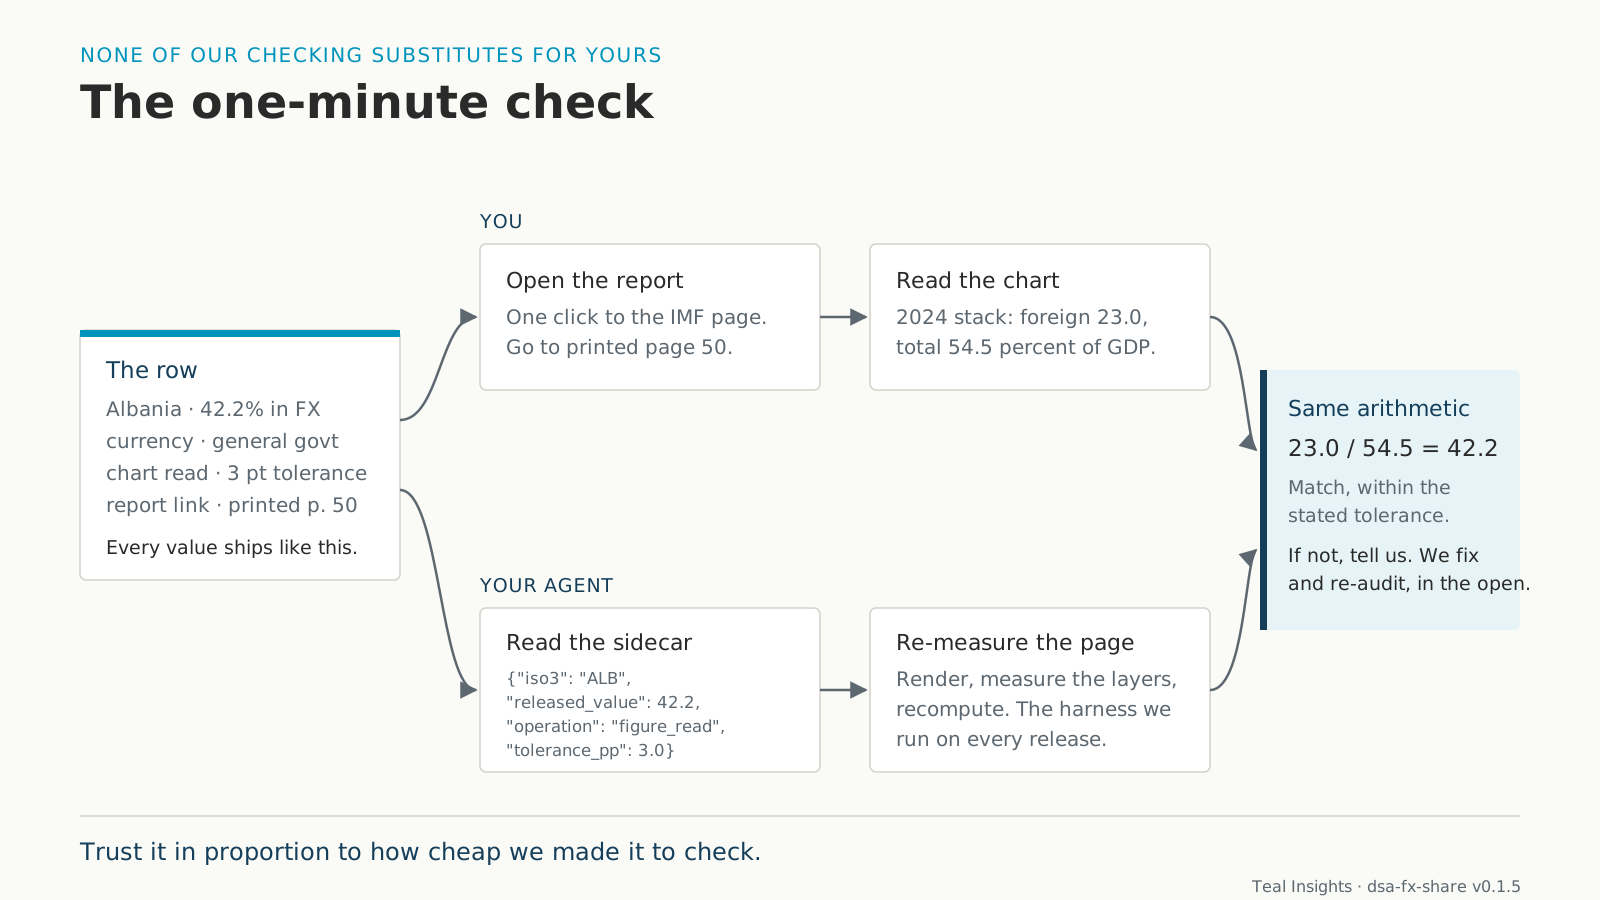
Check us, with your eyes or your agent
None of our checking substitutes for yours, so we made yours cheap: a table row checks against its arithmetic, a chart row against its tolerance band, either one in about a minute. Humans get directions in plain prose on every row. Agents get the same directions structured, in a provenance sidecar with one machine-readable record per row. The checking manual covers both kinds of reader. This is the part we most hope gets copied.
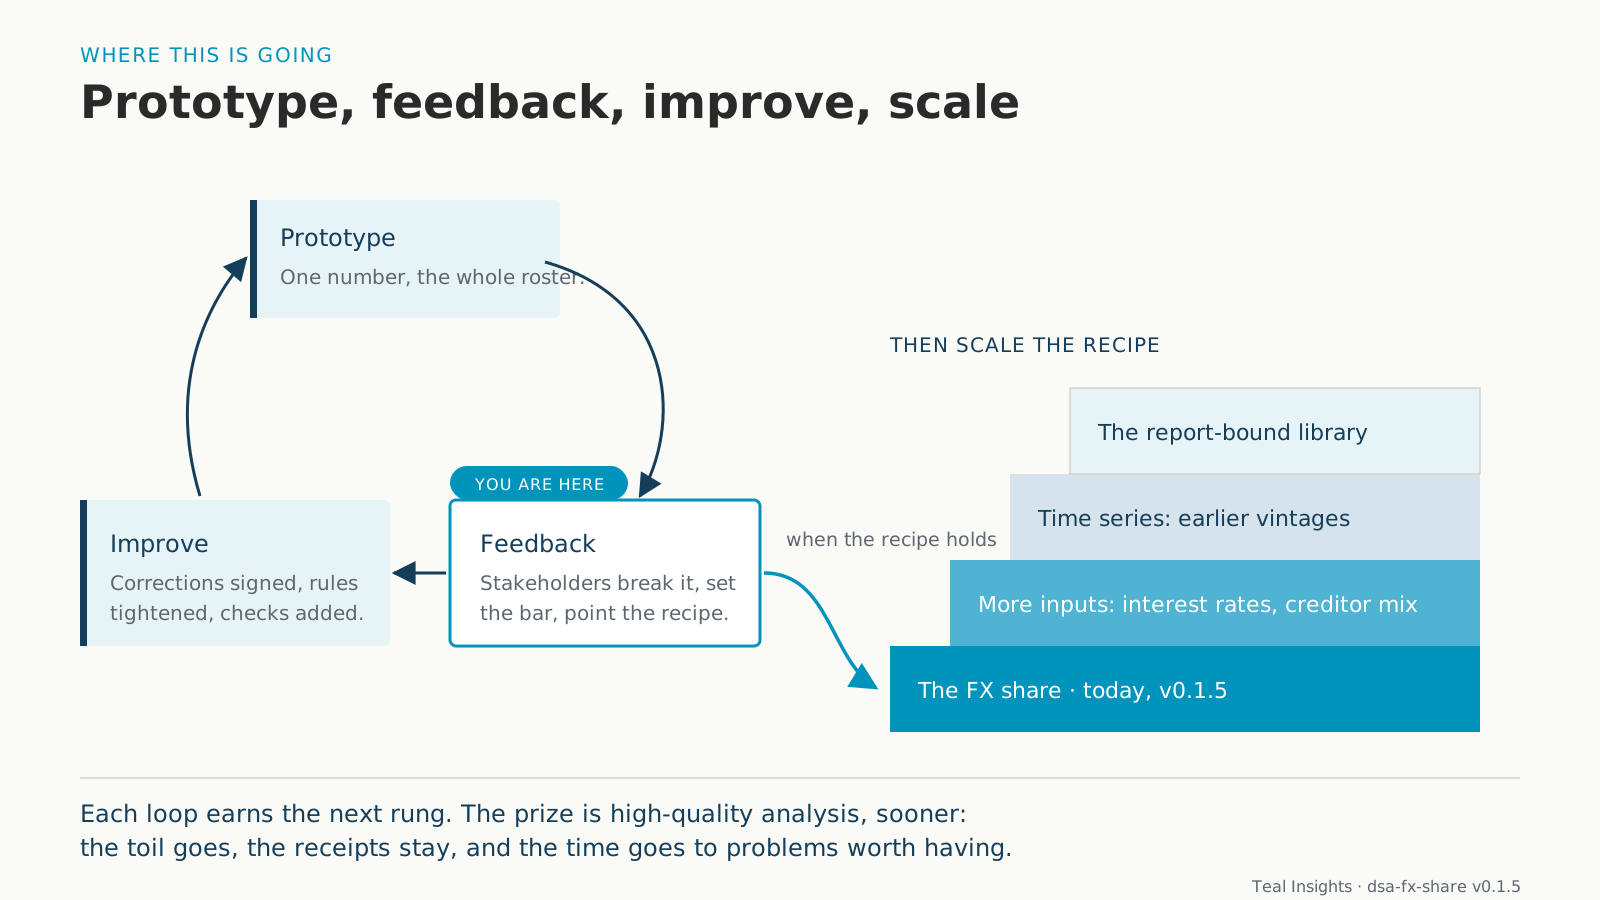
Where this is going
We scoped this on purpose: one number, not a time series, picked because it is useful and a pain to get. That is the prototype pattern. Build the first iteration. Surface the hard issues, and this one surfaced year rules, proxy bases, and chart evidence. Take it to the people who run these frameworks. Fold what they say back into the process, then scale the recipe: more inputs, earlier vintages, time series, the whole library of numbers that live only inside reports. Prototype, feedback, improve, scale. The prize is reaching high-quality analysis faster, with the toil gone and the receipts kept, because there are big problems to spend that time on.
Each row's METHOD drawer shows the arithmetic and the page evidence behind the value, the same directions a checker follows.
One row is one country: the foreign-currency share of its public debt, as a percent of total public debt, with the report page the value was read from. Proxy marks the 34 rows read on a residency basis, which is the share owed to non-residents. Read those as a bound on the FX share, not as a measurement of it. No value here is comparable across countries without conditioning on basis and perimeter. Open Method on any row for the arithmetic and the pages it was read from, in the dataset's own words.
Framework
How the value was read
Currency basis
Showing all 167 rows
Swipe the table sideways to reach every column.
FX share of public debt for 167 countries, read from the debt sustainability analyses published in IMF staff reports. One row is one country: its foreign-currency share of public debt as a percent of total public debt, the vintage of that share, the definitional metadata, and the report page the value was read from. Each country is followed by a Method row that expands to show the arithmetic behind its value and the pages that evidence it. Rows marked Proxy are residency based and bound the FX share rather than measuring it. The values are not comparable across countries without conditioning on basis and perimeter.
On PDF page 81, Table 2 shows the latest actual year as 2020, with “Public sector debt 1/” equal to 7.5 percent of GDP and its subordinate “of which: external debt” row also equal to 7.5 percent of GDP.
The table’s definition box explicitly states “Definition of external/domestic debt: Currency-based,” so external debt is usable as a direct foreign-currency measure rather than a residency proxy.
Footnote 1 states: “Coverage of debt: The central government, central bank.” This establishes debt_perimeter=central_government and incl_central_bank=y despite the generic public-sector table title.
Text Table 2 on PDF page 80 marks central government and central bank as covered; guarantees and non-guaranteed SOE debt are not marked as covered.
How it was readBulk live read codex_cli/gpt-5.6-sol, prompt dsa-fxshare-report-pages-v3. Candidate page image sha256=551d8bc031804a151f2f821dd4fbbe4373ff9bd50b514965aefd49759ee99bb6.
Visible arithmetic: approximately 23.0 ÷ 54.5 × 100 = 42.2 percent of total debt.
Evidence
PDF page 56 (printed page 50) directly presents “Debt by Currency (Percent of GDP)” with separate Foreign currency and Local currency series.
The note immediately beneath the currency chart states: “The perimeter shown is general government.”
The projection marker begins after the 2024 historical observation, making 2024 the latest visible actual year.
At 2024, the foreign-currency area is approximately 23.0 percent of GDP. Total public debt is 54.5 percent of GDP, also shown exactly for 2024 in the selected-economic-indicators table.
This is a direct currency-based measure, not an external-debt proxy. Values involving the figure are estimates, so confidence is below high.
How it was readBulk live read codex_cli/gpt-5.6-sol, prompt dsa-fxshare-report-pages-v3. Candidate page image sha256=ca69b2ad0ce4dc0dfd73c12a54f4c4d35375bcdc13975e43a15c1fc844cd9a71.
Visible arithmetic: 100.0 percent total debt - approximately 99.0 percent dinar-denominated debt = approximately 1.0 percent foreign-currency debt.
Evidence
Evidence: PDF pages 7 and 38 report 2024 gross government debt of 48.5 percent of GDP, excluding guarantees; the economy-wide gross external-debt row of 1.1 percent of GDP is a different aggregate and is not used.
PDF pages 23, 40, and 67 discuss the near absence of external borrowing or economy-wide external debt but do not by themselves establish the public-debt FX share.
PDF page 60 (printed page 53), Annex IV Figure 2, selects central-government DSA coverage; only budgetary central government is included, while the central bank and public corporations are excluded.
PDF page 61 (printed page 54), Annex IV Figure 3, directly charts Debt by Currency and states: around 99 percent of debt is held domestically and denominated in dinars. The same commentary places this statement in the 2024 central-government debt discussion.
Approximate direct currency observation. The figure commentary says around 99 percent of 2024 debt is denominated in dinars, implying around 1 percent in foreign currency; it is not an external-debt proxy.
This row carries no separate arithmetic clause. The derivation is described in the evidence below.
Evidence
PDF page 57 (printed page 52), DSA Summary Assessment: “significant currency exposure—with about 70 percent of public debt denominated in foreign currency.” This is a direct currency-denomination share: approximately 70 / 100 = 70 percent of total public debt.
PDF page 58 (printed page 53) provides the DSA coverage footnote: the public-debt perimeter covers central-government domestic and external debt; external debt of Sonangol and TAAG; public guarantees; and reported external liabilities of other state entities, including external arrears. This supports classification as public_sector rather than a narrower central- or general-government perimeter.
The page-58 coverage matrix marks the central bank as not included. The coverage footnote explicitly includes public guarantees and external debt of the state-owned Sonangol and TAAG.
The observation is dated 2025 in the surrounding assessment and is historical/actual rather than a projection.
How it was readBulk live read codex_cli/gpt-5.6-sol, prompt dsa-fxshare-report-pages-v3. Candidate page image sha256=238ce2e6f9310fc67b3a73c158f662a420c3af43fa0cde2e4e1c47d22c54deb5.
Method: the calculation and evidence for Antigua and Barbuda
Calculation
Visible arithmetic: approximately 24.0 / 68.3 × 100 = 35.1 percent of total debt. Because the numerator is read from an unlabeled chart scale, this is a figure estimate rather than an exact reported value.
Evidence
PDF page 40 (printed page 36) directly labels the upper chart “Debt by currency (percent of GDP)” and distinguishes Foreign currency, Local currency, and Local-linked debt.
The chart’s coverage note states: “The perimeter shown is central government.”
The final historical point is 2025; the projection marker begins after 2025. The 2025 foreign-currency layer is approximately 24 percent of GDP.
PDF page 4 reports 2025 public debt stock at 68.3 percent of GDP; its footnote states that this includes central-government guarantees of state enterprises’ and statutory bodies’ debt.
How it was readBulk live read codex_cli/gpt-5.6-sol, prompt dsa-fxshare-report-pages-v3. Candidate page image sha256=3fe4a4aebd3f77dbf85e75865165fbc915c4f4c327d79c05d1c333d742f20d7d.
Method: the calculation and evidence for Argentina
Calculation
From the 2025 stacked area, foreign-currency debt is approximately 44 percent of GDP and total debt approximately 79 percent of GDP; visible arithmetic: 44 / 79 × 100 ≈ 55.7 percent.
Evidence
The top panel of Table 4 visibly decomposes debt into “Foreign currency” and “Local currency,” establishing a currency basis.
The chart’s note states: “The perimeter shown is central government.”
The projection marker begins after 2025, so 2025 is the latest historical actual observation.
Values are chart estimates rather than printed data labels, so confidence is below high.
How it was readBulk live read codex_cli/gpt-5.6-sol, prompt dsa-fxshare-report-pages-v3. Candidate page image sha256=62777f32e8a3efa6795ec0a0cc2b23dddf61362ccb0d0942657f86025222b4ad.
Visible arithmetic: 23.9 / 49.0 x 100 = 48.7755 percent, rounded to 48.8 percent of total debt. The domestic and foreign components also sum to the reported denominator: 25.0 + 23.9 = 48.9, a 0.1-point difference attributable to displayed rounding.
Evidence
Evidence: PDF pages 2, 3, and 5 establish the Armenia report identity. PDF page 4 is an earlier selected-indicators table and does not provide the decisive currency split.
PDF page 23, printed page 19, reports 2025 central-government debt of 47.3 percent of GDP, while PDF page 24, printed page 20, reports external debt and an external-public component; those rows have different carriers and are not combined.
Canonical PDF page 25, printed page 21, Table 3a reports 2025 public-sector debt of 49.0 percent of GDP, domestic-currency debt of 25.0 percent, and foreign-currency debt of 23.9 percent.
Table 3a footnote 4 defines the public-sector carrier as central government and central bank, establishing public_sector as the faithful perimeter, with the central bank included and no SOE or guarantee component.
Canonical Table 3a directly reports the 2025 public-sector debt denominator and its domestic- and foreign-currency components. Footnote 4 defines the carrier as public-sector debt comprising central government and central bank, so the reviewed perimeter is public_sector with central-bank inclusion. The value is direct currency evidence, not an external-debt or IDS proxy.
Method: the calculation and evidence for Australia
Calculation
Visible arithmetic: At 2024, foreign-currency debt is 0.0 percent of GDP and total general-government debt is positive at about 50 percent of GDP; 100 x 0.0 / positive total = 0.0 percent of total debt.
Evidence
Evidence: PDF page 55 (printed page 49) is an explicit Debt by Currency chart for Australia; its panel note states that the perimeter is general government.
The canonical PDF is vector, not raster. At the 2024 actual point the foreign-currency series coincides exactly with the zero baseline; the foreign series is nonzero in 2015-2016, confirming that the category is encoded and not silently omitted.
PDF page 54 selects general-government DSA coverage and excludes the central bank and public nonfinancial corporations.
PDF pages 4, 8, and 18 contain no compatible debt-by-currency measure and were not used.
Manual source adjudication of an automatic invalid-arithmetic abstention. The exact zero is supported by the canonical vector chart, but confidence remains medium under schema v0's figure-read cap; no validator, schema, source, or gold-set gate was changed.
Evidence limitation, disclosed: the report's text does not state the currency of issuance anywhere, so this zero rests on the chart evidence described above. The 2026-07-29 second-model verification pass rendered every page this row cites and, under the rule that a stated zero needs an explicit source statement, scored the row not confirmable; no evidence in any pass contradicted the value.
Method: the calculation and evidence for Azerbaijan
Calculation
Visible arithmetic: 9.0 ÷ 21.7 × 100 ≈ 41.5 percent of total debt. Values are graphical estimates rather than tabled figures.
Evidence
The upper chart is explicitly titled “Debt by Currency (In Percent of GDP)” and separates Foreign currency, Local currency, and Local-linked debt.
The note directly below the currency chart states: “The perimeter shown is general government.”
The projection marker begins after the 2023 observation, making 2023 the latest visible historical actual year.
From the stacked-area chart at 2023, foreign-currency debt is approximately 9.0 percent of GDP and total debt approximately 21.7 percent of GDP.
The separate governing-law pie chart is not used because governing law is not a currency measure.
How it was readBulk live read codex_cli/gpt-5.6-sol, prompt dsa-fxshare-report-pages-v3. Candidate page image sha256=f15250731e65c9db11b2ad045f7d3bf0ae13474c3055c4c2bca88785fe140a8b.
Method: the calculation and evidence for Bahamas, The
Calculation
This row carries no separate arithmetic clause. The derivation is described in the evidence below.
Evidence
The upper panel is explicitly labeled “Debt by Currency (Percent of GDP)” and its legend distinguishes “Foreign currency,” “Local currency,” and “Local-linked,” establishing a currency basis.
The figure note states: “The perimeter shown is consolidated public sector.”
The projection marker begins after the 2024 actual observation, making 2024 the latest visibly supported historical year.
At 2024, the foreign-currency area is approximately 40 percent of GDP and total stacked debt is approximately 84 percent of GDP, read from the chart’s 20-percentage-point y-axis grid. The implied FX share would be about 40/84 × 100 = 47.6 percent, but the components are returned because the figure does not directly label that ratio.
How it was readBulk live read codex_cli/gpt-5.6-sol, prompt dsa-fxshare-report-pages-v3. Candidate page image sha256=07382a48944ffb9e437b44d4fe0941b373b909cde6a829defa0f4f561afc93ef.
Method: the calculation and evidence for Bangladesh
Calculation
Visible arithmetic: 19.5 / 42.1 × 100 = 46.32 percent of total debt.
Evidence
PDF page 87 marks FY2023–FY2025 as Actual; the latest actual column is FY2025.
In FY2025, the parent row 'Public sector debt 1/' is 42.1 percent of GDP and its indented 'of which external debt' row is 19.5 percent of GDP.
The page explicitly defines external/domestic debt as 'Currency-based' and says there is no material difference between the two criteria, so the external component is direct foreign-currency debt rather than a residency proxy.
Coverage footnote 1 states: central government, central bank, and government-guaranteed debt. This establishes a central-government base perimeter with the central bank and guarantees included.
PDF page 68 states that non-guaranteed SOE debt is excluded from the DSA coverage.
How it was readBulk live read codex_cli/gpt-5.6-sol, prompt dsa-fxshare-report-pages-v3. Candidate page image sha256=530b9a33fdb5d464b49fa531586ee750c0944db3d5f3c500ffb8d465de2ad9ba.
This row carries no separate arithmetic clause. The derivation is described in the evidence below.
Evidence
The upper panel is explicitly labeled “Debt by Currency (Percent of GDP)” and separates “Foreign currency,” “Local currency,” and “Local-linked,” establishing a currency basis.
The note directly below that panel states: “The perimeter shown is central government.”
The latest visible historical observation is 2025; the projection segment begins after 2025.
At 2025, the stacked figure visibly indicates foreign-currency debt of about 38.4 percent of GDP and total debt of about 96.0 percent of GDP. The implied FX share is 38.4 / 96.0 × 100 = 40.0 percent, but the component values are returned because the figure reports percent-of-GDP amounts rather than a directly labeled share of total debt.
How it was readBulk live read codex_cli/gpt-5.6-sol, prompt dsa-fxshare-report-pages-v3. Candidate page image sha256=2a8f6e56f82186302a421c715a4aa7a43fc6505ec646025e41aed732436da165.
Visible arithmetic: At 2024, foreign-currency debt is 0.0 percent of GDP and the currency-chart total is positive at about 103 percent of GDP; 100 x 0.0 / positive total = 0.0 percent of total debt.
Evidence
Evidence: PDF page 55 (printed page 49) is an explicit Debt by Currency chart; the panel-specific note states that the perimeter is consolidated public sector.
The canonical vector chart contains no foreign-currency area series at any year. At the 2024 actual point the entire positive stack is local currency; the local-linked series is also degenerate at zero.
PDF page 54 records the underlying DSA subsectors and excludes the central bank and public nonfinancial corporations; its commentary describes the debt coverage as general government, while the selected carrier's own note says consolidated public sector.
PDF page 14 is holder-residency evidence, not currency composition. PDF page 52 is narrative debt-profile context and was not used for the reviewed value.
Manual source adjudication of an automatic invalid-arithmetic abstention. The exact zero is supported by the canonical vector chart, but confidence remains medium under schema v0's figure-read cap; no validator, schema, source, or gold-set gate was changed.
Evidence limitation, disclosed: the report's text does not state the currency of issuance anywhere, so this zero rests on the chart evidence described above. The commentary's closest wording characterizes the debt as predominantly domestic-currency without stating a zero. The 2026-07-29 second-model verification pass rendered every page this row cites and, under the rule that a stated zero needs an explicit source statement, scored the row not confirmable; no evidence in any pass contradicted the value.
Visible arithmetic: 41 / 65 × 100 ≈ 63.1 percent of total debt. Values are chart estimates rather than printed data labels.
Evidence
Figure 2 directly classifies debt by currency as “Foreign currency,” “Local currency,” and “Local-linked,” establishing a currency basis.
The note under the currency chart states: “The perimeter shown is consolidated public sector.”
The projection segment begins after the 2023 endpoint, so 2023 is the latest visible historical actual observation.
At 2023, the stacked chart visibly indicates approximately 41 percent of GDP in foreign-currency debt and approximately 65 percent of GDP in total debt.
How it was readBulk live read codex_cli/gpt-5.6-sol, prompt dsa-fxshare-report-pages-v3. Candidate page image sha256=295c35836e4977355d7d154b27e10a9d323496fe9ac07f9f984c95319c7d78db.
Visible arithmetic: 47.4 / 60.5 × 100 = 78.35 percent, matching the table's reported 78.3 percent after rounding.
Evidence
PDF page 100, Table 1 reports 2024 total debt of 60.5 percent of GDP and external debt of 47.4 percent of GDP; the external row is 78.3 percent of total debt.
PDF page 93 states that the DSA covers central-government and central-bank debt and that external debt is defined on a currency basis, except that BOAD debt is treated as external for DSA purposes.
PDF page 93, Text Table 1 checks central government and central-bank debt borrowed on behalf of government; guarantees and non-guaranteed SOE debt are unchecked. The accompanying text explicitly says guaranteed and non-guaranteed SOE debt are not included.
PDF page 19 independently describes the end-2024 composition as 78 percent of debt externally denominated.
How it was readBulk live read codex_cli/gpt-5.6-sol, prompt dsa-fxshare-report-pages-v3. Candidate page image sha256=89444e062778658dab6c7eb1377f70a2b5bd0cc67668b4ba8886df073eb87512.
Visible arithmetic: 107.4 / 117.7 x 100 = 91.25 percent, consistent with the report's rounded 91 percent share.
Evidence
Evidence: PDF page 56 states that end-FY2024/25 PPG debt was 118 percent of GDP and external debt was 91 percent of total debt.
PDF page 57 repeats the 91/9 external-domestic split and shows external debt as 69 percent Indian rupee and 31 percent convertible currency.
PDF page 55 defines external debt by residency and establishes public-sector coverage including the central bank and non-guaranteed domestic SOE debt.
PDF page 68 reports 2025 actual public-sector debt of 117.7 percent of GDP and external debt of 107.4 percent of GDP.
The report directly states that external debt was 91 percent of total PPG debt at end-FY2024/25. External debt is residency-based. Page 57 provides currency composition only for the external subset, so the total-debt value remains an explicit proxy.
At 2024, the foreign-currency area is approximately 30 percent of GDP and total debt is approximately 95 percent of GDP; visible arithmetic gives 30.0 / 95.0 × 100 = 31.6 percent of total debt.
Evidence
The upper figure is explicitly labeled “Debt by Currency (Percent of GDP)” and separates “Foreign currency,” “Local currency,” and “Local-linked.”
The note directly beneath the currency figure states: “The perimeter shown is nonfinancial public sector.”
The projection marker begins after 2024, making 2024 the latest visibly historical actual observation.
This is a figure-derived estimate, so confidence is below high.
How it was readBulk live read codex_cli/gpt-5.6-sol, prompt dsa-fxshare-report-pages-v3. Candidate page image sha256=5106675d973cbb1a59c8d635ff29eac329d1f7ea60fbf3068f546be7ad7126d5.
Method: the calculation and evidence for Bosnia and Herzegovina
Calculation
This row carries no separate arithmetic clause. The derivation is described in the evidence below.
Evidence
The upper chart is explicitly labeled “Debt by Currency (Percent of GDP)” and its legend distinguishes “Foreign currency,” “Local currency,” and “Local-linked.”
The chart’s note explicitly states: “The perimeter shown is general government.”
The projection marker begins after 2024, making 2024 the latest visibly historical actual observation.
At 2024, the foreign-currency area is approximately 19.5 percent of GDP and the top of the stacked debt area is approximately 29.5 percent of GDP, read from the chart’s 10-percentage-point y-axis grid. The implied FX share is about 19.5 / 29.5 × 100 ≈ 66.1 percent, but the component values are returned for pipeline computation because the figure does not directly label the ratio.
How it was readBulk live read codex_cli/gpt-5.6-sol, prompt dsa-fxshare-report-pages-v3. Candidate page image sha256=d3e2c17487dd5b9efd6c454a0ba7fb09974cbbd022b6d0c83703fa6ccbb76c36.
Chart re-measurement correction (v0.1.5, signed 2026-07-30). Visible arithmetic: At 2024, the latest actual year, the foreign-currency layer measures 33.5 percent of the total currency stack: 600 dpi pixel measurement at the single 2024 vertex, foreign-layer height / total-stack height x 100 = 33.5 percent.
Evidence
Evidence: The upper panel of PDF page 43, printed page 37, is explicitly labeled “Debt by Currency (Percent of GDP)” and distinguishes “Foreign currency,” “Local currency,” and “Local-linked,” establishing a currency basis.
The figure’s coverage note states: “The perimeter shown is general government.”
The projection portion begins after the 2024 actual; therefore 2024 is the latest historical observation visible.
Corroboration: the Public Debt by Governing Law pie for 2024 shows roughly a third of debt under foreign law plus multilateral, consistent with a one-third foreign-currency share.
Correction lineage: v0.1.4 carried 38.7 from component reads of approximately 12 over 31 percent of GDP taken at inconsistent points on the steep post-2023 segment; corrected by same-vertex measurement (chart re-measurement run, review/chart-recheck-v0.1.5/).
Visible arithmetic: 4.5 ÷ 87.3 × 100 = 5.15 percent of total general government gross debt.
Evidence
In Table 1 under Public sector finances, the 2024 actual value for “General government gross debt” is 87.3 percent of GDP.
The immediately subordinate row “Of which: Foreign currency linked” is 4.5 percent of GDP in 2024, so its denominator is the parent general-government gross-debt row.
The table labels 2025–30 as projections; therefore 2024 is the latest historical actual observation.
The phrase “Foreign currency linked” establishes a currency basis; this is a direct FX measure, not an external-debt proxy.
How it was readBulk live read codex_cli/gpt-5.6-sol, prompt dsa-fxshare-report-pages-v3. Candidate page image sha256=b532c86b9856e04f54afa6c73e17b31c23b255ada667df2b1f45c0a0870d06a4.
Visible arithmetic: 17 / 24 × 100 = 70.8 percent of total debt. This is currency-based and is not a proxy.
Evidence
The top panel is explicitly labeled “Debt by Currency (Percent of GDP)” and distinguishes Foreign currency, Local currency, and Local-linked debt.
The coverage note directly below the currency panel states: “The perimeter shown is general government.”
The projection marker begins at 2025, so 2024 is the latest visibly historical actual observation.
At 2024, the stacked area visibly indicates foreign-currency debt of approximately 17 percent of GDP and total debt of approximately 24 percent of GDP.
How it was readBulk live read codex_cli/gpt-5.6-sol, prompt dsa-fxshare-report-pages-v3. Candidate page image sha256=aa76f0665a225afab8aa2c3753785f40a3ef804626ac07a6e3495fb214d665fd.
Method: the calculation and evidence for Burkina Faso
Calculation
Visible arithmetic: 25.5 / 57.2 × 100 = 44.58 percent of total public-sector debt.
Evidence
PDF page 136 (printed page 16), Table 3 reports 2024 as an Actual year: public sector debt = 57.2 percent of GDP and the subordinate row 'of which: external debt' = 25.5 percent of GDP.
The page explicitly labels the definition of external/domestic debt as 'Currency-based,' so the external component is usable as foreign-currency debt rather than a residency proxy.
The coverage footnote states: central government, state and local governments, central bank, and non-guaranteed SOE debt. This establishes a public-sector perimeter, inclusion of the central bank, and inclusion of non-guaranteed SOE debt.
How it was readBulk live read codex_cli/gpt-5.6-sol, prompt dsa-fxshare-report-pages-v3. Candidate page image sha256=83cc2bc4f00e06ac35a4340bf874e5f9a860a8f1a9d3cd20c43d24ce75dbe5e2.
Visible arithmetic: 727.6 / 2,818.1 x 100 = 25.82 percent, which rounds to the table's reported 25.8 percent.
Evidence
Evidence: PDF page 103 reports total debt of 2,818.1 and external debt of 727.6, with the latter shown as 25.8 percent of total debt.
PDF page 90 defines external debt by residency and limits the base perimeter to central-government external and domestic debt.
PDF page 91 marks central government, guarantees, and central-bank borrowing on behalf of government as covered; non-guaranteed SOE debt is unmarked.
Latest actual is end-2025. Table 1 reports a 25.8 percent residency-based external share of central-government debt. Retain only as an explicit proxy; no direct currency split is disclosed.
Visible arithmetic: 25.9 / 26.1 × 100 = 99.23 percent of total debt.
Evidence
In Table 2, the latest actual column is 2024; the parent row “Public sector debt 1/” is 26.1 percent of GDP and its indented “of which: external debt” row is 25.9 percent of GDP.
The table’s definition box explicitly states that external/domestic debt is “Currency-based,” so the external component is direct foreign-currency debt rather than a residency proxy.
Coverage footnote 1 states: “The central government, central bank, government-guaranteed debt, non-guaranteed SOE debt.” This establishes a central-government base perimeter with the central bank, guarantees, and non-guaranteed SOE debt included.
How it was readBulk live read codex_cli/gpt-5.6-sol, prompt dsa-fxshare-report-pages-v3. Candidate page image sha256=2d522695022252766c7fc836a0ecd91c6844c673865d700bca1dd4cc677ef040.
Visible arithmetic: 28.4 / 43.4 x 100 = 65.44 percent, which rounds to 65.4 percent.
Evidence
Evidence: PDF page 87 reports 2024 actual public-sector debt of 43.4 percent of GDP and external debt of 28.4 percent of GDP.
The page 87 definition box and footnote both identify the selected public-DSA basis as residency-based.
The same definition box says the residency and currency criteria differ materially.
Footnote 1 includes central government, central bank, government-guaranteed debt, and non-guaranteed SOE debt.
Latest actual is 2024. Table 2 defines the public-DSA external-debt row by residency and says the residency and currency criteria differ materially. Retain the calculated external share only as an explicit proxy.
Visible arithmetic: approximately 6 / 109 × 100 = 5.5 percent of total debt.
Evidence
The upper panel is explicitly labeled “Debt by Currency (Percent of GDP)” and separates “Foreign currency,” “Local currency,” and “Local-linked,” establishing a currency basis.
The note directly below the panel states: “The perimeter shown is general government.”
The latest historical point before the projection portion is 2024. From the plotted stacked areas, foreign-currency debt is approximately 6 percent of GDP and total debt is approximately 109 percent of GDP.
“Local-linked” is shown separately from foreign-currency debt; it is not included in the FX numerator. Its plotted amount is effectively zero, supporting domestic_fx_linked_flag=n for this observation.
The values are estimates read from a figure rather than printed data labels, so confidence is below high.
How it was readBulk live read codex_cli/gpt-5.6-sol, prompt dsa-fxshare-report-pages-v3. Candidate page image sha256=6cfe3ba5279c5cd5d5c6c1be3428841617f9298d53af2ac3db9671fc2bd4e1e1.
Method: the calculation and evidence for Cape Verde
Calculation
Visible arithmetic: Annex II: 79.4 / 115.2 x 100 = 68.9236 percent, consistent with its printed 68.9 percent share. Public DSA Table 3: 80.2 / 124.7 x 100 = 64.3144 percent, which rounds to 64.3. The 4.6-point difference cannot be reconciled from visible source evidence.
Evidence
Evidence: PDF page 57 (printed page 51), Annex II Table 1, reports 2023 total debt of 115.2 percent of GDP, external debt of 79.4 percent of GDP, and an external share of 68.9 percent of total debt. The footnote says its debt coverage is the same as the DSA.
PDF page 92 states that the public DSA covers central government debt and selected guarantees, including uncalled domestically guaranteed SOE debt and municipalities, and defines external debt on a residency basis.
PDF pages 95 and 97 state that end-2023 public-sector debt was about 125 percent of GDP, external public debt was about 80 percent of GDP, and domestic debt was 35.8 percent of total public debt, including uncalled guarantees.
A full-source check of PDF page 115 (printed page 25), Table 3, reports 2023 actual public-sector debt of 124.7 percent of GDP and external debt of 80.2 percent of GDP. Its footnote covers central government plus extrabudgetary funds, central bank, and government-guaranteed debt.
Table 3 on PDF page 115 defines external debt by residency and explicitly says there is a material difference between residency and currency criteria. Its currency-composition chart has no numeric labels precise enough to support a reviewed FX-share value.
The two residency carriers therefore disagree materially on denominator and share despite Annex II's same-coverage footnote: 68.9 percent on PDF page 57 versus 64.3 percent from the public DSA on PDF page 115.
Public DSA Table 3 controls: 80.2 / 124.7 = 64.3 percent. Retain only as a residency proxy because the report says residence and currency materially differ.
Method: the calculation and evidence for Central African Republic
Calculation
Visible arithmetic: 32.0 / 60.7 x 100 = 52.72 percent, which would round to 52.7 percent under the dataset's one-decimal convention.
Evidence
Evidence: PDF page 117 reports 2024 actual public-sector debt of 60.7 percent of GDP and external debt of 32.0 percent of GDP.
The definition box on PDF page 117 says Residency-based and says there is no material difference between the criteria.
Footnote 1 on the same page says the definition of external debt is currency-based.
The preceding external-DSA table on PDF page 116 also labels the external-debt definition Residency-based.
Coverage footnote 1 on PDF page 117 lists central, state, and local governments, social security, and government-guaranteed debt.
The visible residency definition box and preceding external-DSA table control over the contradictory footnote. Retain 52.7 only as an explicit residency proxy.
Visible arithmetic: 17.2 / 32.8 x 100 = 52.439 percent, rounded to 52.4 percent at the dataset's one-decimal precision. The incompatible enhanced-safeguards ratio, 3,056 / 6,045 = 50.6 percent, is not merged because its footnote excludes the IMF SDR position and uses a different carrier.
Evidence
Evidence: PDF page 127, Table 2, reports 2024 public-sector debt of 32.8 percent of GDP and its subordinate external-debt row at 17.2 percent of GDP; the definition box labels external/domestic debt residency-based.
PDF page 113 states that coverage is central government, central bank, and government-guaranteed debt and that guaranteed external debt of the public oil company is included, while non-guaranteed SOE debt is handled in the contingent-liability stress test.
PDF page 126, Table 1, independently reports 2024 external debt of 17.2 percent of GDP and labels the definition residency-based.
PDF page 55, Text Table III.1, reports an enhanced-safeguards aggregate of US$6,045 million total and US$3,056 million external, but its footnote excludes the IMF SDR position and notes that this differs from the report and DSA aggregates; it is therefore not used for the reviewed DSA share.
PDF pages 48 and 54 provide program and enhanced-safeguards context, while PDF page 115 describes 2024 financing developments; none supplies a compatible direct currency share.
Table 2 reports the latest actual 2024 public-sector debt and external-debt GDP shares. Their ratio supports a 52.4 percent residency-based proxy. The enhanced-safeguards debt-composition table uses a different aggregate that excludes the IMF SDR position and is not substituted for the DSA carrier.
Visible arithmetic: 14.5 / 41.5 × 100 ≈ 35.0 percent of total debt.
Evidence
The debt-by-currency chart explicitly separates Foreign currency, Local currency, and Local-linked debt and states that the perimeter shown is central government.
The latest historical observation before the projection period is 2025. The stacked chart visibly shows foreign-currency debt at approximately 14.5 percent of GDP and total debt at approximately 41.5 percent of GDP.
The figure commentary corroborates the estimate by stating that the foreign-currency share is stable at around a third of total debt.
The values are read from a figure rather than printed data labels, so they are approximate and confidence is below high.
How it was readBulk live read codex_cli/gpt-5.6-sol, prompt dsa-fxshare-report-pages-v3. Candidate page image sha256=ef5b4945bf6f6085ccbf6a3e4a91ac210e983e88f216561d9511ed30e650e4e7.
Visible arithmetic: 28.5 / 60.5 × 100 ≈ 47.1 percent of total debt. This is a currency-based measure, not a residency or governing-law proxy.
Evidence
Figure 3's top panel is directly labeled “Debt by Currency (Percent of GDP)” and distinguishes “Foreign currency,” “Local currency,” and “Local-linked.”
The figure note explicitly states: “The perimeter shown is nonfinancial public sector.”
The projection marker begins after 2024, so 2024 is the latest visibly historical actual observation.
At 2024, the chart visually shows foreign-currency debt at approximately 28.5 percent of GDP and total debt at approximately 60.5 percent of GDP.
How it was readBulk live read codex_cli/gpt-5.6-sol, prompt dsa-fxshare-report-pages-v3. Candidate page image sha256=f2a85e15ae3506ea13b3f52b191c5d65092b25097ad045e57dd5daa8cfad3bc1.
Method: the calculation and evidence for Congo, Democratic Republic of the
Calculation
Visible arithmetic: 14.5 / 22.5 x 100 = 64.44 percent, which rounds to the source-reported 64.4 percent.
Evidence
Evidence: PDF page 142 reports 2024 actual public-sector debt of 22.5 percent of GDP and external debt of 14.5 percent of GDP.
The page 142 definition box and footnote both identify the basis as residency-based.
PDF page 125 independently reports external debt as 64.4 percent of total debt for 2024.
PDF page 122 and the page 142 footnote establish coverage of government levels, central bank, guarantees, and non-guaranteed SOE debt.
Latest actual is 2024. The table defines external debt by residency. The source's no-material-difference statement supports comparability but does not turn the inverse residency proxy into a direct currency measure.
Method: the calculation and evidence for Congo, Republic of
Calculation
Visible arithmetic: 39.4 / 99.0 × 100 = 39.8 percent of total debt.
Evidence
PDF page 132 (printed page 34), Table 3, shows 2023 under the Actual columns: Public Sector Debt = 99.0 percent of GDP and its subordinate row 'of which: external Debt' = 39.4 percent of GDP.
The table's definition box explicitly states: 'Definition of external/Domestic Debt: Currency-based,' so the external-debt row is a direct foreign-currency measure rather than a residency proxy.
Coverage footnote 1 states: 'Coverage of Debt: The central government plus social security, central bank, government-guaranteed Debt.' Accordingly, the base perimeter is central government, with the central bank and guarantees explicitly included.
How it was readBulk live read codex_cli/gpt-5.6-sol, prompt dsa-fxshare-report-pages-v3. Candidate page image sha256=b4ae03e039d34bd2da1b2d03731538ecb5d1d3850a2946dd0367283cc715b91c.
Method: the calculation and evidence for Costa Rica
Calculation
Visible arithmetic: approximately 21 / 60 × 100 = 35 percent of total debt in foreign currency. Values are chart estimates rather than printed data labels.
Evidence
The upper panel is explicitly labeled “Debt by Currency (Percent of GDP)” and separates “Foreign currency” from “Local currency,” establishing a currency basis.
The figure note explicitly states: “The perimeter shown is central government.”
The projection marker begins after 2025, making 2025 the latest visibly historical actual year.
At 2025, the chart visibly indicates foreign-currency debt of approximately 21 percent of GDP and total debt of approximately 60 percent of GDP.
How it was readBulk live read codex_cli/gpt-5.6-sol, prompt dsa-fxshare-report-pages-v3. Candidate page image sha256=aca1353623de3e146cbb3f44476bfaee4f6cadf31f3a90a6a23b592a372d182f.
Method: the calculation and evidence for Côte d'Ivoire
Calculation
Visible arithmetic: 38.3 / 60.0 × 100 = 63.83 percent of total debt.
Evidence
Table 5 reports 2024 under Actual: public sector debt = 60.0 percent of GDP and the subordinate row 'of which: external debt' = 38.3 percent of GDP.
The table’s classification box explicitly states: 'Definition of external/domestic debt: Currency-based.' Therefore the external component is a direct foreign-currency measure, not a residency proxy.
Coverage footnote 1 states that debt covers the central, state, and local governments plus social security, central bank, and government-guaranteed debt. This supports a general-government base perimeter with the central bank and guarantees included.
2024 is the latest column labeled Actual; 2025 onward is labeled Projections.
How it was readBulk live read codex_cli/gpt-5.6-sol, prompt dsa-fxshare-report-pages-v3. Candidate page image sha256=b6c93ee07da36c8930a5cd92e0fd49a3ec2c7b51197eefe92224880efcb4be20.
Visible arithmetic: At the 2024 point on PDF page 51, the foreign-currency vector layer has exactly zero thickness and the total currency stack is positive. Therefore 100 x 0 / positive total = 0 percent of total debt.
Evidence
Evidence: PDF page 51 (printed page 45) is an explicit Debt by Currency chart. Its panel note states that the perimeter is consolidated public sector, and 2024 is the latest actual observation before projections.
The canonical vector chart places the foreign-currency series exactly on the zero baseline in 2024 while encoding nonzero foreign-currency bands in other years. The 2024 local-currency stack is positive and the local-linked layer is degenerate at zero.
PDF page 50 (printed page 44) selects public-sector coverage but includes only budgetary central government, extra-budgetary funds, social security funds, state government, and local government. It excludes public nonfinancial corporations, the central bank, other public financial corporations, and government-guaranteed debt.
PDF pages 6 and 42 report general-government and external-debt indicators. PDF page 48 is a balance-of-payments and external-debt table, and page 56 is an external-sector assessment. None was treated as the DSA FX-share measure.
Manual source adjudication of an automatic invalid-arithmetic abstention. The exact zero is supported by the canonical vector chart and is recorded with a +/-0.1 percentage-point figure tolerance. Confidence remains medium under schema v0's figure-read cap; no validator, schema, source, or gold-set gate was changed.
Evidence limitation, disclosed: the report's text does not state the currency of issuance anywhere, so this zero rests on the chart evidence described above. The 2026-07-29 second-model verification pass rendered every page this row cites and, under the rule that a stated zero needs an explicit source statement, scored the row not confirmable; no evidence in any pass contradicted the value.
Visible arithmetic: The source directly states a zero foreign-currency numerator, and 2025 general-government debt is positive at 55.0 percent of GDP; therefore 0 / 55.0 x 100 = 0 percent.
Evidence
Evidence: PDF pages 4, 6, and 14 establish the Cyprus report identity, selected economic indicators, and outlook context.
PDF page 43, printed page 39, Table I.1's DSA Summary Assessment states that Cyprus's debt ratio fell below 60 percent in 2025 and that the debt stock has no foreign-currency debt.
PDF page 46, printed page 42, Figure I.1 labels the Debt by Currency panel general government and states that public debt is wholly denominated in local currency.
PDF page 4 reports positive 2025 general-government debt of 55.0 percent of GDP, supplying a positive denominator and ruling out a zero-debt ambiguity.
The holder and governing-law panels on PDF page 46 are not treated as currency measures; the zero is supported by the explicit DSA text and currency panel.
The DSA Summary Assessment directly states that the 2025 debt stock has no foreign-currency debt. Figure I.1 corroborates a positive general-government denominator and wholly local-currency composition. The exact zero is source-stated, not inferred from an unreadably thin figure layer.
Method: the calculation and evidence for Czech Republic
Calculation
Visible arithmetic: 2.5 / 42.5 × 100 ≈ 5.9 percent of total debt. Values are estimates read from a figure, not exact tabulated observations.
Evidence
The upper panel is explicitly labeled “Debt by Currency (percent of GDP)” and separates Foreign currency, Local currency, and Local-linked debt.
The coverage note directly below the panel states: “The perimeter shown is general government.”
The projection marker begins at 2025, making 2024 the latest visibly historical actual observation.
From the plotted 2024 stack, foreign-currency debt is approximately 2.5 percent of GDP and total debt approximately 42.5 percent of GDP.
How it was readBulk live read codex_cli/gpt-5.6-sol, prompt dsa-fxshare-report-pages-v3. Candidate page image sha256=925698c92233b7c080c350c4f10fbc04405f376152318d3482c2cb286d8aa038.
Visible arithmetic: 68.9 / 68.9 x 100 = 100.0 percent.
Evidence
Evidence: PDF page 63 (printed page 12), Table 2, marks 2024 as Actual and reports public-sector debt of 68.9 percent of GDP and its subordinate external-debt row also at 68.9 percent of GDP.
The page defines external debt on a residency basis and says there is no material difference between residency and currency criteria.
Table 2 footnote 1 covers the central government, central bank, and government-guaranteed debt.
PDF page 53 states that the DSA captures central-government debt and guarantees on SOE external debt, while non-guaranteed SOE debt is outside the captured perimeter.
No IDS value or non-DSA external-debt carrier is used.
Latest actual is 2024. The table's parent and child rows are both 68.9 percent of GDP. Retain 100.0 only as an explicit residency proxy; the table's no-material-difference statement does not turn the residency carrier into a direct currency measure.
Visible arithmetic: 72.3 / 108.2 x 100 = 66.8207 percent, which rounds to 66.8 under the dataset's one-decimal convention.
Evidence
Evidence: PDF page 82 (printed page 15), Table 3, marks 2024 as Actual and reports public-sector debt of 108.2 percent of GDP and its subordinate external-debt row at 72.3 percent of GDP.
The page defines external debt on a residency basis and says there is no material difference between residency and currency criteria.
Table 3 footnote 1 covers central-government and government-guaranteed debt.
PDF page 69 states that public-sector debt includes central-government direct and guaranteed debt, that non-guaranteed SOE debt is excluded, and that there is no central-bank borrowing on behalf of government.
No IDS value or non-DSA external-debt carrier is used.
Latest actual is 2024. Apply the dataset's one-decimal convention to the visible parent-child ratio. Retain only as an explicit residency proxy, even though the table says the residency and currency criteria do not materially differ.
Method: the calculation and evidence for Dominican Republic
Calculation
Visible arithmetic: approximately 33.0 / 58.1 × 100 = 56.8 percent of total debt.
Evidence
PDF page 56 (printed page 50), Figure 3 labels the upper panel “Debt by Currency (Percent of GDP)” and separately identifies “Foreign currency” and “Local currency.”
The projection marker begins after 2024, making 2024 the latest visibly historical actual observation. The foreign-currency layer in 2024 is approximately 33.0 percent of GDP.
PDF page 58 (printed page 52), Figure 4 reports actual 2024 public debt of 58.1 percent of GDP.
PDF page 56 states that the perimeter is the consolidated public sector. PDF page 57 explains that this CPS perimeter includes the NFPS plus central-bank quasi-fiscal debt.
How it was readBulk live read codex_cli/gpt-5.6-sol, prompt dsa-fxshare-report-pages-v3. Candidate page image sha256=a34e3504186cae93de47b4416e986ccb6d2e8e42997aeee7b50a2a5b3f150eb8.
Visible arithmetic: At 2025, foreign-currency debt is 0.0 percent of GDP and total NFPS debt is 54.3 percent of GDP; 100 x 0.0 / 54.3 = 0.0 percent of total debt.
Evidence
Evidence: PDF page 64 (printed page 59) is an explicit Debt by Currency chart and states that the perimeter is the nonfinancial public sector.
The canonical vector chart contains no foreign-currency area series at the 2025 actual point; the entire positive stack is local currency and the local-linked series is degenerate at zero.
PDF page 5 reports 2025 public-sector debt of 54.3 percent of GDP, providing the positive denominator.
PDF page 63 selects NFPS coverage, includes public nonfinancial corporations, and excludes the central bank. PDF page 43 is balance-of-payments and external-debt evidence and was not substituted for currency composition.
Manual source adjudication of an automatic invalid-arithmetic abstention. The exact zero is supported by the canonical vector chart, but confidence remains medium under schema v0's figure-read cap; no validator, schema, source, or gold-set gate was changed.
Evidence limitation, disclosed: the report's text does not state the currency of issuance anywhere, so this zero rests on the chart evidence described above. The 2026-07-29 second-model verification pass rendered every page this row cites and, under the rule that a stated zero needs an explicit source statement, scored the row not confirmable; no evidence in any pass contradicted the value.
Visible arithmetic: 33.0 ÷ 92.0 × 100 ≈ 35.9 percent of total debt. This is a currency-based direct FX share, not an external-debt proxy.
Evidence
The upper panel is explicitly labeled “Debt by Currency (percent of GDP)” and distinguishes Foreign currency, Local currency, and Local-linked debt.
The note directly beneath that panel states: “The perimeter shown is general government.”
The projection marker begins after 2025, making 2025 the latest visibly historical observation.
At 2025, the chart visually indicates foreign-currency debt of approximately 33 percent of GDP and total debt of approximately 92 percent of GDP.
How it was readBulk live read codex_cli/gpt-5.6-sol, prompt dsa-fxshare-report-pages-v3. Candidate page image sha256=b62bc8f5f3957c6d2f45bdce4c99904b7606cfa305c24f0a16238d8d69702bf0.
Method: the calculation and evidence for El Salvador
Calculation
Visible arithmetic: At 2024, foreign-currency debt is exactly 0.0 percent of GDP and the NFPS currency-chart total is positive at about 87 percent of GDP; 100 x 0.0 / positive total = 0.0 percent of total debt.
Evidence
Evidence: PDF page 79 (printed page 72) is an explicit Debt by Currency chart and says its perimeter is the nonfinancial public sector. The 2024 actual stack is positive and entirely in the local-currency vector layer; no positive foreign-currency or local-linked layer is encoded.
PDF page 78 selects NFPS coverage. It includes public nonfinancial corporations and excludes the central bank; guarantees are not established by the visible coverage fields.
PDF page 66 is an external-sector table. It was rejected as a substitute because external debt is not equivalent to the DSA currency-denomination measure.
PDF pages 4 and 5 provide report and introductory context. El Salvador's dollarized context does not override the explicit classifications used by the selected DSA carrier.
Manual source adjudication of an automatic invalid-arithmetic abstention. The canonical vector currency carrier supports an exact zero at the 2024 actual point; the source's dollarized setting does not justify replacing its local-currency classification with external-debt evidence. The zero is recorded with a +/-0.1 percentage-point figure tolerance; confidence remains medium, and no gate was changed.
Corroborating statement, not an explicit issuance statement: PDF page 76 (printed page 69) notes that "dollar-denominated debt has not presented fiscal risks given official dollarization." The report text does not state the issuance currency directly; the zero rests on the chart's zero-thickness foreign-currency layer, read with the US dollar as the domestic currency under official dollarization.
Method: the calculation and evidence for Equatorial Guinea
Calculation
At 2024, the foreign-currency layer is visibly about 7.8 percent of GDP and total debt about 36.4 percent of GDP; the latter is also visibly reported as 36.4 for 2024 in Table 1. Implied arithmetic: 7.8 / 36.4 × 100 ≈ 21.4 percent of total debt. Because the currency component is read from a figure, it is retained as components rather than reported as a direct labeled share.
Evidence
PDF page 53 (printed page 46) contains Table 3's figure titled “Debt by Currency (Percent of GDP).”
The figure legend directly decomposes debt into “Foreign currency,” “Local currency,” and “Local-linked,” establishing a currency basis rather than residency or governing law.
The note directly below the currency figure states: “The perimeter shown is central government.”
The projection marker begins after 2024, so 2024 is the latest historical actual observation.
How it was readBulk live read codex_cli/gpt-5.6-sol, prompt dsa-fxshare-report-pages-v3. Candidate page image sha256=4de77a378176d6c53c65762010fb9ef9d6806b70229ec52f9973c8251f88c3d1.
Visible arithmetic: At 2024, foreign-currency debt is 0.0 percent of GDP and the currency-chart total is positive at about 23.6 percent of GDP; 100 x 0.0 / positive total = 0.0 percent of total debt.
Evidence
Evidence: PDF page 59 (printed page 53) is an explicit Debt by Currency chart; its panel note states that the perimeter is consolidated public sector.
The canonical vector chart visibly encodes a foreign-currency band in 2015, then places the foreign-currency series exactly on the zero baseline from 2016 through the 2024 actual point. This distinguishes a genuine zero from an omitted series.
PDF page 58 selects consolidated-public-sector coverage and includes public nonfinancial corporations, the central bank, and other public financial corporations.
PDF pages 42, 45, 48, and 53 contain general-government totals, external debt, a foreign-currency debt rating, and external-sector evidence. None is equivalent to the selected DSA currency measure.
Manual source adjudication of an automatic invalid-arithmetic abstention. The exact zero is supported by the canonical vector chart, but confidence remains medium under schema v0's figure-read cap; no validator, schema, source, or gold-set gate was changed.
Explicit currency statement: PDF page 56 (printed page 50) states: "No currency risk exists since all debt obligations are denominated in euros."
Visible arithmetic implies an FX share of roughly 28 / 80 × 100 = 35 percent of total debt; the direct share field is left null because the source plots GDP components rather than labeling the percentage-of-total share.
Evidence
The upper chart is explicitly labeled “Debt by Currency (In percent of GDP)” and separates “Foreign currency” from “Local currency.”
The figure note explicitly states: “The perimeter shown is central government.”
For 2025, the last historical observation before the projection period, the stacked chart visibly shows foreign-currency debt at approximately 28 percent of GDP and total debt at approximately 80 percent of GDP.
The values are read from a figure rather than a numerical table, so they are approximate and confidence is capped below high.
How it was readBulk live read codex_cli/gpt-5.6-sol, prompt dsa-fxshare-report-pages-v3. Candidate page image sha256=635db24a05512a0f644b2bf4efec3ed05adf8412ab9801800942b8f8bb485270.
Visible arithmetic: Vector geometry on PDF page 43: 100 x 1.583862 / 69.351181 = 2.2838 percent of total debt, recorded as 2.3 percent. Table 3 on PDF page 39 reports the 2024 total at 82.1 percent of GDP, so the corresponding foreign-currency component is about 1.9 percent of GDP.
Evidence
Evidence: PDF page 43 (printed page 37) is an explicit Debt by Currency chart; its panel note states that the perimeter is general government and its projection marker begins after 2024.
The canonical vector chart encodes a nonzero cyan foreign-currency band at the 2024 actual point. Its 1.583862-point thickness over the 69.351181-point total stack gives a 2.2838 percent share, rounded to 2.3 percent.
PDF page 39 (printed page 33), Table 3, reports 2024 general-government gross debt of 82.1 percent of GDP, corroborating the positive total and implying foreign-currency debt of about 1.9 percent of GDP.
PDF page 42 selects general-government coverage but includes the central bank, public nonfinancial corporations, and other public financial corporations in the baseline; the currency panel itself remains explicitly labeled general government. The local-linked vector layer is degenerate at zero in 2024.
PDF pages 25 and 35 are macroprudential and financial-sector context. PDF pages 47 and 49 are external-sector evidence; none was substituted for the DSA currency measure.
Manual source correction of an automatic invalid-arithmetic abstention. The 2024 vector chart contains a thin but nonzero foreign-currency band; the reviewed share is rounded to one decimal with a +/-0.1 percentage-point tolerance. Confidence remains medium under schema v0's figure-read cap, and no validator, schema, source, or gold-set gate was changed.
Visible arithmetic: 34 ÷ 65 × 100 ≈ 52.3 percent of total debt.
Evidence
The top panel is explicitly labeled “Debt by Currency (Percent of GDP)” and separates Foreign currency, Local currency, and Local-linked debt.
The figure footnote states: “The perimeter shown is central government.”
The projection marker begins after the 2023 historical endpoint, so 2023 is the latest visible actual observation.
At 2023, the stacked chart visibly indicates foreign-currency debt of about 34 percent of GDP and total debt of about 65 percent of GDP.
A separate Local-linked category is shown, supporting domestic_fx_linked_flag=y; it is not included in the foreign-currency numerator.
How it was readBulk live read codex_cli/gpt-5.6-sol, prompt dsa-fxshare-report-pages-v3. Candidate page image sha256=9831c669c249d4e3b133a2e3312a3414f275490e9c1be8d94af7ebe215445a66.
Method: the calculation and evidence for Gambia, The
Calculation
Visible arithmetic: 50.1 / 78.5 × 100 = 63.82 percent of total debt.
Evidence
Table 3 identifies 2022–2024 as actual observations; the latest actual year is 2024.
For 2024, the parent row “Public sector debt 1/” is 78.5 percent of GDP, and its subordinate row “of which: external debt” is 50.1 percent of GDP.
The table’s definition box states “Definition of external/domestic debt: Currency-based” and “Is there a material difference between the two criteria? No.” Thus the external component is direct currency-based FX debt, not a residency proxy.
Footnote 1 states: “Coverage of debt: The central government, central bank, government-guaranteed debt. Definition of external debt is Currency-based.” This establishes a central-government base perimeter with the central bank and guarantees included.
The public-debt-coverage text on PDF page 82 states that non-guaranteed state-owned-enterprise debt is not included in the DSA perimeter.
How it was readBulk live read codex_cli/gpt-5.6-sol, prompt dsa-fxshare-report-pages-v3. Candidate page image sha256=85300a71b6070009c4cca699d9566027d0f3b04eb540c290d7f6090864546385.
At 2025, the foreign-currency area is approximately 23 percent of GDP and the full stacked perimeter is approximately 34 percent of GDP. Visible arithmetic implies an FX share of roughly 23 / 34 × 100 = 67.6 percent, but the component values are figure estimates, so the direct-share field is left null for pipeline computation.
Evidence
PDF page 44 (printed page 40) shows Figure 2, with the top panel labeled “Debt by Currency (Percent of GDP).”
The legend visibly separates “Foreign currency,” “Local currency,” and “Local-linked,” establishing a currency basis and indicating that domestic FX-linked debt is separately represented.
The projection marker begins after the 2025 endpoint; therefore 2025 is the latest visibly historical actual observation.
The note directly below the currency panel states: “The perimeter shown is general government.”
How it was readBulk live read codex_cli/gpt-5.6-sol, prompt dsa-fxshare-report-pages-v3. Candidate page image sha256=b5a5f1845ce5684ad633de30e31dd9f573e22c4fb11d77fa735a7cbd39d9caa2.
Visible arithmetic: At 2024, foreign-currency debt is 0.0 percent of GDP and total general-government debt is 62.2 percent of GDP; 100 x 0.0 / 62.2 = 0.0 percent of total debt.
Evidence
Evidence: PDF page 67 (printed page 62) is an explicit Debt by Currency chart and states that the perimeter is general government.
The canonical vector chart contains no foreign-currency area series at the 2024 actual point. It separately contains a visible local-linked layer, so that layer was flagged but was not reclassified as foreign currency.
PDF page 5 reports 2024 public debt of 62.2 percent of GDP, providing the positive denominator. Its external-debt figure of 147.6 percent of GDP is incompatible with the DSA debt perimeter and was not used.
PDF page 66 selects general-government coverage, excludes the central bank and public nonfinancial corporations, and reports guarantees outside the selected debt stock.
Manual source adjudication of an automatic invalid-arithmetic abstention. The exact zero is supported by the canonical vector chart, but confidence remains medium under schema v0's figure-read cap; no validator, schema, source, or gold-set gate was changed.
Evidence limitation, disclosed: the report's text does not state the currency of issuance anywhere, so this zero rests on the chart evidence described above. The commentary's closest wording characterizes the debt as almost entirely domestic-currency without stating a zero. The 2026-07-29 second-model verification pass rendered every page this row cites and, under the rule that a stated zero needs an explicit source statement, scored the row not confirmable; no evidence in any pass contradicted the value.
Visible arithmetic: US$29,585 million / US$55,783 million x 100 = 53.0359 percent, which rounds to the table's printed 53.0 percent.
Evidence
Evidence: PDF page 104 (printed page 5), Text Table 2, is titled Decomposition of Public Debt at end-2024 (Residency basis).
The table reports total debt of US$55,783 million, equal to 100.0 percent of total debt and 69.7 percent of GDP.
The external row reports US$29,585 million, equal to 53.0 percent of total debt and 37.0 percent of GDP.
PDF page 103 states that the DSA classifies debt by creditor residency and that this includes local-currency domestic debt held by nonresidents.
The coverage table on PDF page 103 includes central government, central bank, government-guaranteed debt, and non-guaranteed SOE debt.
PDF page 105 does not contain Text Table 2; the original page pin was off by one and is corrected to PDF page 104.
Latest actual is end-2024. The table is physically on PDF page 104, not page 105. Retain the reported 53.0 percent only as an explicit residency proxy.
Visible arithmetic: At 2024, the embedded carrier contains no foreign-currency layer while the general-government debt stack is positive at roughly 154 percent of GDP; 100 x 0.0 / positive total = 0.0 percent of total debt.
Evidence
Evidence: PDF page 44 (printed page 40) explicitly labels the selected carrier Debt by Currency and states that its perimeter is general government.
In the source’s embedded figure image, the exact foreign-currency color appears only in earlier years and ends well before 2024. At the 2024 actual point the positive stack contains no foreign-currency or local-linked pixels; the commentary says public debt is almost entirely denominated in domestic currency.
PDF page 43 selects general-government coverage, includes public nonfinancial corporations, and excludes the central bank; guarantees are not established by the visible fields.
PDF page 4 reports external debt at 237.7 percent of GDP for 2025. It was rejected because external debt is not equivalent to the DSA currency-denomination measure.
PDF pages 3, 5, and 6 provide board, report-identity, and contents context, not a competing public-debt currency share.
Manual source correction of a low-confidence abstention. The canonical embedded figure image shows the foreign-currency layer ending before the 2024 actual point, where the positive stack is entirely local currency; the commentary says debt is almost entirely domestic currency. The exact 2024 zero is recorded with a +/-0.1 percentage-point figure tolerance; confidence remains medium, and no gate was changed.
Visible arithmetic: 81.7 percent residency share - about 7.9 percentage points = about 73.8 percent of total public-sector debt on a currency basis.
Evidence
Evidence: PDF page 67, Text Table 3, reports 2024 total public-sector debt of 1,014.5 million, 100.0 percent of total debt and 72.7 percent of GDP; external debt is 828.4 million, 81.7 percent of total debt and 59.4 percent of GDP.
PDF page 67 footnote 7 defines external debt by residency and says the share using the currency criterion is about 7.9 percentage points lower because some nonresident-held debt is denominated in Eastern Caribbean dollars.
PDF page 69 describes foreign-exchange risk and states that about two-thirds of foreign-currency debt is U.S.-dollar denominated, which is consistent with a distinct currency-basis stock but is not itself a total-debt share.
PDF page 79 confirms the 2024 public-sector debt and external-debt GDP ratios, labels the baseline external/domestic definition residency-based, and states that the two criteria differ materially.
The coverage footnote on PDF page 79 includes central, state, and local governments, the central bank, government-guaranteed debt, and non-guaranteed SOE debt.
Text Table 3 reports the 2024 residency-based external share as 81.7 percent of total public-sector debt. Footnote 7 says the share using the currency criterion is about 7.9 percentage points lower because some nonresident-held debt is in Eastern Caribbean dollars. The resulting direct currency-basis share is approximately 73.8 percent.
Method: the calculation and evidence for Guatemala
Calculation
Visible arithmetic: 12.3 / 26.3 × 100 ≈ 46.8 percent of total debt. These are figure-read estimates rather than printed data labels.
Evidence
PDF page 59 (printed page 54) contains a figure explicitly titled “Debt by Currency (Percent of GDP)” with separate “Foreign currency” and “Local currency” areas.
The figure’s note states: “The perimeter shown is central government.”
The projection marker begins after 2024, so 2024 is the latest visibly historical actual observation.
From the plotted 2024 boundary, foreign-currency debt is approximately 12.3 percent of GDP and total debt is approximately 26.3 percent of GDP.
How it was readBulk live read codex_cli/gpt-5.6-sol, prompt dsa-fxshare-report-pages-v3. Candidate page image sha256=8b0b5fd34abc8fb9027e1c225b9b2ba311142550b3fdb0b35620b63aafa53825.
Visible arithmetic: 19.7 / 40.3 × 100 = 48.88 percent of total debt.
Evidence
Table 2 shows the latest actual year as 2023: public sector debt = 40.3 percent of GDP and its subordinate 'of which: external debt' row = 19.7 percent of GDP.
The table's definition box explicitly states that external debt is currency-based, so the external component is direct foreign-currency debt rather than a residency proxy.
Table 2 footnote 1 defines coverage as central government plus social security, central bank, and government-guaranteed debt; therefore the base perimeter is central government, with central-bank debt and guarantees included.
The coverage discussion on PDF page 87 states that non-guaranteed state-owned-enterprise debt is not included.
How it was readBulk live read codex_cli/gpt-5.6-sol, prompt dsa-fxshare-report-pages-v3. Candidate page image sha256=b0ddf2a65c6dc3be5997cf49d3abe60dc5e6c5d60b7fa216f7bceffe18921930.
Method: the calculation and evidence for Guinea-Bissau
Calculation
Visible arithmetic: 28.3 / 75.1 × 100 = 37.68 percent of total debt.
Evidence
PDF page 82 (printed page 24), Table 2 marks 2023–2025 as Actual. For 2025, the parent row “Public sector debt 1/” is 75.1 percent of GDP and its subordinate row “of which: external debt” is 28.3 percent of GDP.
The table’s definition box explicitly states “Definition of external/domestic debt: Currency-based,” so the external-debt component is usable directly as foreign-currency debt rather than as a residency proxy.
Table footnote 1 defines coverage as “The central government, central bank, government-guaranteed debt,” establishing a central-government base perimeter with the central bank and guarantees included.
PDF page 61 states that non-guaranteed SOE debt is not covered and is excluded from the DSA baseline because of data limitations.
How it was readBulk live read codex_cli/gpt-5.6-sol, prompt dsa-fxshare-report-pages-v3. Candidate page image sha256=51bbde5ec5aea52323c2e1745d21263f007af7d025a619e519e64baf492e31ff.
Visible arithmetic: 2.2 / 15.1 x 100 = 14.57 percent, rounded to 14.6 percent.
Evidence
Evidence: PDF page 110, Table 4, reports FY2024 public debt of 15.1 percent of GDP and external debt of 2.2 percent of GDP.
The same table defines external/domestic debt by residency and states that there is no material difference between the two criteria; the extraction rule still requires a residency observation to remain an explicit proxy.
PDF page 110 footnote 1 defines coverage as central, state, and local governments plus extra-budgetary funds, supporting a general-government perimeter.
PDF page 95 footnote 10 says the DSA public-sector coverage does not include the central bank.
PDF page 92 says data are unavailable for guaranteed debt and non-guaranteed SOE debt, so both flags remain unknown.
The latest actual column reports public debt of 15.1 percent of GDP and residency-based external debt of 2.2 percent of GDP. The 14.6 percent ratio is retained only as an explicit residency proxy.
Visible arithmetic: 27.5 / 47.6 × 100 = 57.77 percent of total public-sector debt.
Evidence
PDF page 117 (printed page 16), Table 2: the latest historical actual column is 2023; projections begin in 2024.
For 2023, the parent row “Public sector debt 1/” is 47.6 percent of GDP, and its indented child row “of which: external debt” is 27.5 percent of GDP.
The table’s definition box explicitly states that external/domestic debt is “Currency-based,” so the external component is a direct foreign-currency measure, not a residency proxy.
Coverage footnote 1 states: “Coverage of Debt: The entire public sector, including SOEs.” This supports debt_perimeter=public_sector and inclusion of nonguaranteed SOEs.
How it was readBulk live read codex_cli/gpt-5.6-sol, prompt dsa-fxshare-report-pages-v3. Candidate page image sha256=edcd517cf345cb72eb3039a8f0a2529233a8d9f7e8cf75d08d8f982bda446649.
Visible arithmetic: approximately 23.0 ÷ 73.5 × 100 = 31.3 percent of total debt.
Evidence
PDF page 56 (printed page 51) contains a chart explicitly labeled “Debt by Currency (Percent of GDP)” with components “Foreign currency,” “Local currency,” and “Local-linked.”
The chart note explicitly states: “The perimeter shown is general government.”
The projection marker begins after the 2024 observation, so 2024 is the latest historical actual year.
The 2024 foreign-currency component is visually about 23 percent of GDP. Table 1 reports 2024 general-government public debt at 73.5 percent of GDP.
The separate “Local-linked” category visibly establishes that domestic/local-linked debt exists, so domestic_fx_linked_flag is y.
How it was readBulk live read codex_cli/gpt-5.6-sol, prompt dsa-fxshare-report-pages-v3. Candidate page image sha256=b082102bcec5956962164ce44fb2bc4b8d64727dfbd792029556b60fefb5710b.
Visible arithmetic: 6.5 / 66.5 × 100 ≈ 9.8 percent of total debt; the component values are returned because the figure reports percent-of-GDP amounts rather than a directly labeled FX share.
Evidence
The upper chart is explicitly titled “Debt by Currency (Percent of GDP)” and separates debt into Foreign currency, Local currency, and Local-linked components.
The coverage note directly below the chart states: “The perimeter shown is general government.”
The projection indicator begins after the 2024 observation, making 2024 the latest visibly supported historical actual year.
Reading the 2024 stacked areas against the 0–100 percent-of-GDP axis gives approximately 6.5 percent of GDP in foreign-currency debt and approximately 66.5 percent of GDP in total debt.
The separate “Local-linked” legend category visibly establishes the presence of domestic currency-linked debt.
How it was readBulk live read codex_cli/gpt-5.6-sol, prompt dsa-fxshare-report-pages-v3. Candidate page image sha256=d795986bb280b292bf2b9028c8ce1aad2305ab1c984a713b20078a97cda81dfe.
Method: the calculation and evidence for Indonesia
Calculation
Visible arithmetic: No ratio reconstruction is needed. Table 2 directly reports 28.5 percent of total PSGD for 2024; the 40.2-percent-of-GDP total is a consistency check, not a denominator used to fabricate a missing component.
Evidence
Evidence: PDF page 49 (printed page 43), Table 2, directly reports 28.5 for 2024 in the row Exposed to exchange rate risk (in percent of total PSGD).
Table 2 footnote 5 defines the measure as debt in foreign currency or linked to the exchange rate, so domestic_fx_linked_flag is y. Footnote 3 defines public sector as general government.
Table 2 reports 2024 public-sector gross debt at 40.2 percent of GDP. The 2025 column is projected, making 2024 the latest historical actual observation.
PDF page 72 (printed page 66) selects consolidated general-government coverage and explicitly excludes public guarantees, public nonfinancial corporations, the central bank, and other public financial corporations. PDF page 73 independently triangulates the currency carrier and general-government perimeter.
PDF pages 16, 25, and 28 contain fiscal, monetary, financial-sector, and FX-market context but no substitute DSA debt-currency share.
Directly reported 2024 share of total public-sector gross debt, with the table footnote defining exposure as debt in foreign currency or linked to the exchange rate. Public sector is defined as general government. The value is confirmed without reconstructing a missing numerator and without changing schema or validation gates.
Visible arithmetic: 20.0 ÷ 47.2 × 100 = 42.4 percent of total debt.
Evidence
PDF page 45 (printed page 39) contains Figure 2, whose top panel is explicitly labeled “Debt by Currency (Percent of GDP)” and separates “Foreign currency,” “Local currency,” and “Local-linked.”
The projection marker begins after 2024, so 2024 is the latest visibly historical observation. The 2024 foreign-currency area is approximately 20.0 percent of GDP from the chart.
PDF page 6 (printed page 4) reports 2024 “Total government debt (% of GDP)” of 47.2 under Central Government Finances, consistent with the top panel’s approximately 47 percent total.
The figure repeatedly states: “The perimeter shown is central government.” The basis is currency, not residency or governing law.
How it was readBulk live read codex_cli/gpt-5.6-sol, prompt dsa-fxshare-report-pages-v3. Candidate page image sha256=53d29110a081bea34e6fa00a3b3f520ba4fd023c8fa570bcfa0ae864cbdadb73.
Visible arithmetic: At 2025, foreign-currency debt is exactly 0.0 percent of GDP and the consolidated-public-sector currency-chart total is positive; 100 x 0.0 / positive total = 0.0 percent of total debt.
Evidence
Evidence: PDF page 50 (printed page 44) explicitly labels the selected carrier Debt by Currency. Its panel-specific note says the perimeter is consolidated public sector, and its commentary says public debt is almost entirely in domestic currency.
The canonical vector foreign-currency path reaches the zero baseline by 2018 and remains there through the 2025 actual point. The local-linked path is also degenerate at zero in 2025 while the local-currency stack remains positive.
PDF page 49 describes the DSA coverage as general government and excludes the central bank and public nonfinancial corporations. This is an internal perimeter-label inconsistency, so the reviewed record preserves the selected currency carrier’s public-sector label while using the coverage page only for explicit inclusion flags.
PDF page 46 is an external-sector assessment and was not used as a currency-denomination proxy. PDF pages 6, 8, and 13 provide debt-total, contents, inflation, and labor-market context.
Manual source correction of a low-confidence abstention. The canonical vector foreign-currency path is exactly on the zero baseline from 2018 onward, including the 2025 actual point, and the local-linked path is also degenerate at zero. The exact zero is recorded with a +/-0.1 percentage-point figure tolerance; confidence remains medium, and no gate was changed.
Visible arithmetic: 10 / 68 × 100 ≈ 14.7 percent of total debt. Values are figure estimates rather than printed data labels.
Evidence
The top panel is explicitly labeled “Debt by Currency (Percent of GDP)” and separates Foreign currency, Local currency, and Local-linked debt.
The coverage note directly beneath that panel states: “The perimeter shown is consolidated public sector.”
The projection marker begins after the 2025 observation, making 2025 the latest visibly historical actual year.
At 2025, the stacked total is approximately 68 percent of GDP and the foreign-currency layer approximately 10 percent of GDP, read from the chart axis.
How it was readBulk live read codex_cli/gpt-5.6-sol, prompt dsa-fxshare-report-pages-v3. Candidate page image sha256=fe3080daf3a0e9a7cc2cf4b233678a542224f2aa06eed4c04a90064c781a593f.
Visible arithmetic: At the 2024 point on PDF page 54, the foreign-currency vector layer has exactly zero thickness while the total stack is positive. Therefore 100 x 0 / positive total = 0 percent of total debt. The separately positive local-linked layer is flagged, not added to the foreign-currency numerator.
Evidence
Evidence: PDF page 54 (printed page 48) is an explicit Debt by Currency chart; its panel note states that the perimeter is general government and 2024 is the latest actual year.
The canonical vector chart places the foreign-currency layer exactly on the zero baseline in 2024. The local-currency stack is positive and a separate local-linked layer is visibly and vectorially positive, so domestic_fx_linked_flag is y without reclassifying linked debt as foreign currency.
PDF page 53 (printed page 47) selects consolidated general-government coverage, excludes the central bank and public nonfinancial corporations, and states that government-guaranteed debt is not included unless the guarantee is called.
PDF pages 4, 7, and 10 are Executive Board, report-identity, and macroeconomic context; none provides a competing currency measure.
Manual source adjudication of an automatic invalid-arithmetic abstention. The exact foreign-currency zero and separate positive local-linked layer are supported by the canonical vector chart; the zero is recorded with a +/-0.1 percentage-point figure tolerance. Confidence remains medium under schema v0's figure-read cap, and no gate was changed.
Evidence limitation, disclosed: the report's text does not state the currency of issuance anywhere, so this zero rests on the chart evidence described above. The commentary's closest wording characterizes the debt as predominantly domestic-currency without stating a zero. The 2026-07-29 second-model verification pass rendered every page this row cites and, under the rule that a stated zero needs an explicit source statement, scored the row not confirmable; no evidence in any pass contradicted the value.
From the chart, 2024 foreign-currency debt is approximately 40 percent of GDP and total debt approximately 62 percent of GDP; visible arithmetic gives 40 / 62 × 100 ≈ 64.5 percent of total debt.
Evidence
PDF page 34 (printed page 29) directly labels the upper chart “Debt by Currency (Percent of GDP)” and its components “Foreign currency” and “Local currency.”
The projection marker begins after 2024, so fiscal year 2024 is the latest visibly historical observation.
The coverage note states that the perimeter includes direct central-government debt, guaranteed debt, and debt of public bodies guaranteed by the government, excluding the central bank.
How it was readBulk live read codex_cli/gpt-5.6-sol, prompt dsa-fxshare-report-pages-v3. Candidate page image sha256=cb482f003b8668f6321babbf04d1a50618adcff8f42fc92946c67804be1a11eb.
Visible arithmetic: At 2024, foreign-currency debt is 0.0 percent of GDP and Table 4 reports total general-government gross debt of 214.5 percent of GDP; 100 x 0.0 / 214.5 = 0.0 percent of total debt.
Evidence
Evidence: PDF page 62 (printed page 57) is an explicit Debt by Currency chart; its panel note states that the perimeter is general government and 2024 is the latest actual year.
The canonical vector chart has no foreign-currency area series in the debt stack, while the local-currency stack is positive. The local-linked vector layer is degenerate at zero in 2024.
PDF page 51 (printed page 46), Table 4, reports 2024 general-government gross debt of 214.5 percent of GDP, providing an exact positive denominator.
PDF page 61 (printed page 56) selects consolidated general-government coverage and excludes the central bank, public nonfinancial corporations, and other public financial corporations. The page does not establish whether called guarantees are in the stock, so incl_guarantees remains unknown.
PDF pages 14 and 18 are fiscal and outlook narrative. They were not used as substitutes for currency composition.
Manual source adjudication of an automatic invalid-arithmetic abstention. The exact zero is supported by the canonical vector chart and the exact positive denominator by Table 4; the zero is recorded with a +/-0.1 percentage-point figure tolerance. Confidence remains medium under schema v0's figure-read cap, and no gate was changed.
Explicit currency statement: PDF page 59 (printed page 54) states that "the general government debt is denominated in yen".
Visible arithmetic: 33 / 83 × 100 ≈ 39.8 percent of total debt. Values are chart estimates rather than precisely tabulated observations.
Evidence
The upper panel is explicitly labeled “Debt by Currency (Percent of GDP)” and separates Foreign currency, Local currency, and Alkali-linked debt.
The note directly below the panel states: “The perimeter shown is general government.”
The projection marker begins after 2025, making 2025 the latest visibly historical observation.
From the plotted 2025 values, foreign-currency debt is approximately 33 percent of GDP and total debt approximately 83 percent of GDP.
How it was readBulk live read codex_cli/gpt-5.6-sol, prompt dsa-fxshare-report-pages-v3. Candidate page image sha256=024a8e86c28587a4889edd7103eac42487aad366c9fafe033d22ef6d6631fc14.
Method: the calculation and evidence for Kazakhstan
Calculation
This row carries no separate arithmetic clause. The derivation is described in the evidence below.
Evidence
The top panel is explicitly labeled “Debt by Currency (Percent of GDP)” and separates “Foreign currency,” “Local currency,” and “Local-linked” debt, establishing a currency basis.
The coverage note directly below the panel states: “The perimeter shown is general government.”
The projection marker begins after the 2024 observation, so 2024 is the latest historical actual shown.
Visible figure estimates for 2024 are approximately 6.3 percent of GDP in foreign-currency debt and 24.0 percent of GDP in total debt. The implied FX share would be about 6.3 / 24.0 × 100 = 26.3 percent, but the component fields are returned for pipeline computation.
How it was readBulk live read codex_cli/gpt-5.6-sol, prompt dsa-fxshare-report-pages-v3. Candidate page image sha256=d8939ecaa7441d68d4c6496b7bf51ce8c5b09093387e5bbc8271ef601a1cb9c9.
Visible arithmetic: 40.4 / 73.1 × 100 = 55.27 percent, rounded to 55.3 percent of total debt.
Evidence
PDF page 158 (printed page 26), Table 2 shows the latest actual year as 2023: public sector debt = 73.1 percent of GDP and its indented 'of which: external debt' row = 40.4 percent of GDP.
The page explicitly labels the definition of external/domestic debt as 'Currency-based'; therefore the external-debt component is direct foreign-currency debt evidence, not a residency proxy.
The table's coverage footnote states: central government plus social security, central bank, and government-guaranteed debt. Following the required perimeter rule, the base perimeter is central_government with central bank and guarantees included.
The visible public-debt-coverage discussion says nonguaranteed SOE debt is captured through the contingent-liabilities stress test, while guaranteed SOE debt is included in the public debt stock; thus nonguaranteed SOE debt is not included in the reported stock.
How it was readBulk live read codex_cli/gpt-5.6-sol, prompt dsa-fxshare-report-pages-v3. Candidate page image sha256=35745424af1b3eecc950d6bacb123d0ba80eba0207b33689919b001a398f1cea.
Cross-provider blind-audit correction. PDF page 62 (printed page 3), paragraph 4, reports end-2025 public and publicly guaranteed debt of 8.0 percent of GDP and external debt of 7.8 percent of GDP; domestic guaranteed debt is 0.1 percent of GDP. Visible arithmetic: 7.8 / 8.0 × 100 = 97.5 percent. The 0.1-point component shortfall reflects displayed rounding. PDF page 61 states that the DSA uses a residency basis and covers central government, central-government-guaranteed debt, and the social security fund. Retain only as an explicit residency proxy.
Evidence
Source inconsistency, disclosed per the adjudication record: the report's page 12 currency composition differs from the page 62 paragraph-4 components this release follows; the components carrier is the stronger evidence, and the disagreement sits in the source report itself.
Method: the calculation and evidence for Korea, Republic of
Calculation
Visible arithmetic: Vector geometry on PDF page 57: 100 x 0.882339 / 63.087234 = 1.3986 percent of total debt, recorded as 1.4 percent. Applying the reviewed share to the 44.6-percent-of-GDP total on PDF page 42 implies about 0.6 percent of GDP in foreign-currency debt.
Evidence
Evidence: PDF page 57 (printed page 52) is an explicit Debt by Currency chart; its panel note states that the perimeter is central government and its projection marker begins after 2024.
The canonical vector chart encodes a nonzero cyan foreign-currency band at the 2024 actual point. Its 0.882339-point thickness over the 63.087234-point total stack gives a 1.3986 percent share, rounded to 1.4 percent.
PDF page 42 (printed page 37), Table 1, reports 2024 central-government debt of 44.6 percent of GDP, corroborating the positive denominator and implying foreign-currency debt of about 0.6 percent of GDP.
PDF page 56 (printed page 51) selects consolidated central-government coverage, includes budgetary central government and social security funds, and excludes the central bank and public nonfinancial corporations. It does not establish guarantee inclusion, so that flag remains unknown. The local-linked vector layer is zero in 2024.
PDF pages 5 and 42 contain external-debt and total-debt indicators. Pages 28, 30, and 31 are FX-market, fiscal-scenario, and fiscal-narrative context. None was substituted for the DSA currency measure.
Manual source correction of an automatic invalid-arithmetic abstention. The 2024 vector chart contains a thin but nonzero foreign-currency band; the reviewed share is rounded to one decimal with a +/-0.1 percentage-point tolerance. Confidence remains medium under schema v0's figure-read cap, and no gate was changed.
This row carries no separate arithmetic clause. The derivation is described in the evidence below.
Evidence
PDF page 47 (printed page 42) visibly labels the top panel “Debt by Currency (Percent of GDP)” and separates Foreign currency, Local currency, and Local-linked debt.
The figure explicitly states: “Note: The perimeter shown is general government.”
The projection marker begins after the 2024 observation, making 2024 the latest visibly historical actual year.
From the plotted 2024 stack, foreign-currency debt is approximately 1.2 percent of GDP and total debt is approximately 17.8 percent of GDP. The implied FX share would be about 1.2 / 17.8 × 100 ≈ 6.7 percent, but the direct-share field is left null because the figure reports GDP components and the pipeline computes the ratio.
How it was readBulk live read codex_cli/gpt-5.6-sol, prompt dsa-fxshare-report-pages-v3. Candidate page image sha256=f47bd4365641497c11c794bc2dcf2b64aa8b1de2fc7339ad3a1294993d8bfdab.
Chart re-measurement correction (v0.1.5, signed 2026-07-30). Visible arithmetic: At 2024, the latest actual year, the foreign-currency layer measures 99.5 percent of the total currency stack: 600 dpi pixel measurement, foreign-layer height / total-stack height x 100 = 99.5 percent; the local-currency layer at the 2024 trough is indistinguishable from zero at measurement resolution.
Evidence
Evidence: The upper panel of PDF page 48, printed page 42, is explicitly titled “Debt by Currency (Percent of GDP)” and distinguishes Foreign currency, Local currency, and Local-linked debt.
The figure’s note explicitly states: “The perimeter shown is general government.”
The projection marker begins in 2025, so 2024 is the latest visible historical actual observation.
Corroboration: the Public Debt by Governing Law pie for 2024 on the same page is almost entirely foreign law.
No yellow Local-linked layer is visibly present through 2024.
Correction lineage: v0.1.4 carried 82.8 from component reads of approximately 2.4 over 2.9 percent of GDP at the trough, which overstated the local-currency sliver; corrected by direct stack measurement (chart re-measurement run, review/chart-recheck-v0.1.5/).
Method: the calculation and evidence for Kyrgyz Republic
Calculation
Visible arithmetic: 26.6 / 36.6 × 100 = 72.68 percent of total public debt.
Evidence
PDF page 43 (printed page 38), Figure 1 labels the stacked public-debt series as local-currency denominated and foreign-currency denominated, establishing a currency basis.
The accompanying 2024 text states total public debt was 36.6 percent of GDP and that the relevant lower stack fell to 26.6 percent of GDP; the figure identifies that stack as foreign-currency-denominated debt.
PDF page 65 states that PPG debt coverage includes central and local government, state guarantees, and central-bank debt to the IMF. Text Table 1 marks central government, state and local government, guarantees, and central bank as covered, while non-guaranteed SOE debt is not covered.
How it was readBulk live read codex_cli/gpt-5.6-sol, prompt dsa-fxshare-report-pages-v3. Candidate page image sha256=81678fea073621fea6c324be8037961e3e8400f249cb181c1a0c939deb5f02d3.
Method: the calculation and evidence for Lao People's Democratic Republic
Calculation
Visible arithmetic: 85.0 / 94.0 × 100 = 90.43 percent of total debt.
Evidence
PDF page 101 (printed page 24), Table 2 reports 2024 as an actual observation: “Public sector debt” = 94.0 percent of GDP and its subordinate “of which: external debt” row = 85.0 percent of GDP.
The table’s definition box states that external/domestic debt is “Currency-based,” so the external component is usable as foreign-currency debt rather than a residency proxy.
Coverage footnote 1 states: “Coverage is defined as the sum of interest and amortization of medium and long-term, and short-term debt”; the relevant coverage text states “Coverage of the central government, government-guaranteed debt.” This establishes a central-government perimeter including guarantees.
PDF page 79 clarifies that coverage includes central government and publicly guaranteed SOE debt, while excluding non-guaranteed SOE debt and state and local government debt; its coverage table does not mark central-bank debt as covered.
How it was readBulk live read codex_cli/gpt-5.6-sol, prompt dsa-fxshare-report-pages-v3. Candidate page image sha256=6b6db8d581a0302d6af0e7f3dec66c6984a223e592bf4ec33e491e9a08e309b3.
This row carries no separate arithmetic clause. The derivation is described in the evidence below.
Evidence
The Debt by Currency chart is explicitly measured in percent of GDP and separates Foreign currency, Local currency, and Local-linked debt.
The chart's coverage note states: “The perimeter shown is central government.”
The projection marker begins after the 2024 observation, making 2024 the latest visible historical actual.
From the 2024 stacked area, foreign-currency debt is approximately 4.5 percent of GDP and total debt is approximately 47.5 percent of GDP; the implied FX share would be about 4.5 / 47.5 × 100 = 9.5 percent, but the direct-share field is left null because the displayed values are figure estimates rather than labeled data points.
How it was readBulk live read codex_cli/gpt-5.6-sol, prompt dsa-fxshare-report-pages-v3. Candidate page image sha256=c77103919b127749be3893bfd3a0e9f6cf84def6197fdf3b75ef21f6f8a12d7f.
Chart re-measurement correction (v0.1.5, signed 2026-07-30). Visible arithmetic: At 2021, the latest actual year in this May 2023 report, the foreign-currency layer measures 86.6 percent of the total currency stack: 600 dpi pixel measurement of the vector chart, foreign-layer height / total-stack height x 100 = 86.6 percent, one-decimal display within the figure's +/-3 percentage-point tolerance. The measurement engine reproduces this chart's 2023 point to within 0.4 points of the prior vector-coordinate arithmetic, which bounds the method bias.
Evidence
Evidence: PDF pages 3, 4, and 6 establish the Lebanon report identity, publication context, and staff-report title.
PDF page 45, printed page 40, contains the direct currency carrier. The top panel is Debt by Currency and labels its perimeter central government.
Year adjudication: the chart's Projection bracket begins at 2022, the Public Debt by Holder panel ends at 2021, and the Public Debt by Governing Law pie is dated 2021, so 2021 is the latest actual observation and the 2023 peak is a projection point.
PDF page 45 commentary states that valuation effects on foreign-currency liabilities, particularly Eurobonds, drove the debt spike and that public debt is mainly in foreign currency.
PDF page 39 is a balance-of-payments table and PDF page 49 is the external-sector assessment; their external data are incompatible with the direct public-debt currency carrier and are not substituted.
Correction lineage: v0.1.4 carried 97.7 measured at the 2023 point, which sits inside the projection bracket; corrected to the 2021 actual under the dataset's year rule (chart re-measurement run, review/chart-recheck-v0.1.5/).
Visible arithmetic: 45.6 ÷ 56.8 × 100 = 80.28 percent, rounded to 80.3 percent of total debt.
Evidence
PDF page 84 (printed page 16), Table 3 shows the latest actual column, 2024: public sector debt = 56.8 percent of GDP and its subordinate row “of which: external debt” = 45.6 percent of GDP.
The table explicitly states “Definition of external/domestic debt: Currency-based” and answers “No” to whether there is a material difference between the two criteria; therefore the external component is a direct foreign-currency measure rather than a residency proxy.
Table footnote 1 defines coverage as “The central government, central bank, government-guaranteed debt,” supporting debt_perimeter=central_government, incl_central_bank=y, and incl_guarantees=y.
PDF page 70 states that coverage includes government-guaranteed SOE debt while total SOE debt is not available, supporting exclusion of nonguaranteed SOE debt; its footnote also states there is no locally issued FX-denominated debt, supporting domestic_fx_linked_flag=n.
How it was readBulk live read codex_cli/gpt-5.6-sol, prompt dsa-fxshare-report-pages-v3. Candidate page image sha256=aa5636e395090fd3c3c2d71e8b1e600dfa2a39415452c2b63658aa70edfddb23.
Visible arithmetic: 1,853.0 / 2,841.4 x 100 = 65.21 percent, consistent with the table's 65.2 percent; 35.8 / 54.9 x 100 = 65.21 percent.
Evidence
Evidence: PDF page 140, Text Table 3, reports end-2025 total public debt of 2,841.4 million, 100.0 percent of total debt and 54.9 percent of GDP; external debt is 1,853.0 million, 65.2 percent of total debt and 35.8 percent of GDP.
PDF page 137 defines external debt by residency and states that coverage includes central-government debt, central-government-guaranteed debt, and central-bank debt contracted on behalf of government.
PDF page 137 says SOE debt is generally covered through guarantees or on-lending but that some domestic-bank SOE debt is not covered, so non-guaranteed SOE inclusion remains unknown.
PDF page 140 says most domestic debt is denominated in U.S. dollars but supplies no exact domestic foreign-currency amount or share.
PDF page 164 confirms the 2025 GDP ratios and labels the external/domestic definition residency-based with a material difference between criteria.
Text Table 3 directly reports 2025 external debt at 65.2 percent of total debt and 35.8 percent of GDP against total debt of 54.9 percent of GDP. External debt is residency-based, so 65.2 percent is only a proxy. The report says most domestic debt is U.S.-dollar denominated but does not quantify that subset.
Method: the calculation and evidence for Lithuania
Calculation
Visible arithmetic: At the 2024 actual point on PDF page 58, the foreign-currency vector layer has exactly zero thickness and the total currency stack is positive. The page commentary independently states that no foreign-currency-denominated debt is held. Therefore 100 x 0 / positive total = 0 percent.
Evidence
Evidence: PDF page 58 (printed page 52) explicitly states that since euro introduction Lithuania does not hold any foreign-currency-denominated debt. Its Debt by Currency chart identifies 2024 as the latest actual year before projections.
The canonical vector chart encodes a positive foreign-currency band historically, then places that layer exactly on the zero baseline in 2024. The local-linked layer is also zero at the actual point.
PDF page 57 (printed page 51) selects consolidated general-government coverage and includes public nonfinancial corporations, the central bank, and other public financial corporations. Guarantee inclusion is not established.
PDF page 41 is a balance-of-payments and gross-external-debt table. It was not treated as the DSA currency measure; pages 12 through 14 are labor, fiscal, and financial context.
Manual source adjudication of an automatic invalid-arithmetic abstention. The source commentary directly says Lithuania holds no foreign-currency-denominated debt since euro introduction, and the 2024 vector series is exactly zero. The value is recorded with a +/-0.1 percentage-point figure tolerance and medium confidence; no gate was changed.
Method: the calculation and evidence for Luxembourg
Calculation
Visible arithmetic: At 2025 on PDF page 53, the foreign-currency stack is absent, the local-linked layer is zero, and total debt is positive at about 26 percent of GDP. Therefore 100 x 0 / positive total = 0 percent.
Evidence
Evidence: PDF page 53 (printed page 48) is an explicit Debt by Currency chart with a general-government perimeter and 2025 as the latest actual year before projections.
The canonical vector chart has no foreign-currency area series in the positive debt stack and the local-linked vector layer is zero at 2025. The page commentary says the debt is held in domestic currency, limiting exchange-rate risk.
PDF page 52 (printed page 47) selects general-government coverage and includes public nonfinancial corporations, the central bank, and other public financial corporations. It does not establish guarantee inclusion.
The separate 2025 governing-law panel is not used as currency evidence. PDF pages 2, 6, and 7 are press-release, report-identity, and contents pages.
Manual source adjudication of an automatic invalid-arithmetic abstention. The source says the debt is held in domestic currency and the foreign-currency vector series is absent from the positive stack. The zero is recorded with a +/-0.1 percentage-point figure tolerance and medium confidence; no gate was changed.
Method: the calculation and evidence for Madagascar
Calculation
Visible arithmetic: 37.8 ÷ 52.7 × 100 = 71.73 percent of total public-sector debt.
Evidence
PDF page 167 (printed page 14), Table 2 shows the latest actual year as 2023; 2024 onward is under projections.
For 2023, the parent row “Public sector debt” is 52.7 percent of GDP and its indented “of which: external debt” row is 37.8 percent of GDP.
The table explicitly states “Definition of external/domestic debt: Currency-based” and says there is no material difference between the two criteria, so currency-based external debt is direct foreign-currency debt rather than a residency proxy.
Coverage footnote 1 states: central, state, and local governments; central bank; government-guaranteed debt; and non-guaranteed SOE debt. This supports public_sector perimeter and affirmative inclusion flags for the central bank, guarantees, and non-guaranteed SOEs.
How it was readBulk live read codex_cli/gpt-5.6-sol, prompt dsa-fxshare-report-pages-v3. Candidate page image sha256=8ed69e6faa85fbdf0524879691fb6f2b199f2a59f46972e0946956d304c9749f.
Visible arithmetic: 37.4 / 87.6 x 100 = 42.6941 percent, which rounds to 42.7 under the dataset's one-decimal convention.
Evidence
Evidence: PDF page 106 (printed page 21), Table 2, reports 2024 under Actual: public-sector debt is 87.6 percent of GDP and its subordinate external-debt row is 37.4 percent of GDP.
The table defines external debt on a residency basis and says there is a material difference between the residency and currency criteria.
PDF page 41 independently reports 2024 total public debt of 87.6 percent of GDP and external public-sector debt of 37.4 percent of GDP.
PDF page 88 states that the DSA covers central-government debt, central-government-guaranteed debt, and central-bank debt contracted on behalf of government.
The same coverage page states that non-guaranteed SOE debt is excluded because of data limitations.
Latest actual is 2024. The table defines external debt by residency and says residency and currency materially differ, so retain 42.7 only as an explicit proxy.
Currency-basis arithmetic: foreign-currency share = 100 − 98 = 2 percent of total central-government debt.
Evidence
The figure notes explicitly state: “The perimeter shown is central government.”
The visible commentary states: “98 percent of central government debt is denominated in local currency” in 2024.
The observation is historical actual for 2024; later years shown in the figure are projections.
How it was readBulk live read codex_cli/gpt-5.6-sol, prompt dsa-fxshare-report-pages-v3. Candidate page image sha256=71c973eeaf206c39ad0087fd7a41ce48b1303e3a7c396fcbd1e97d2a9372b16d.
Visible arithmetic: 49.2 / 110.4 × 100 = 44.57 percent of total debt.
Evidence
PDF page 95, printed page 20: the latest historical Actual column is 2022.
For 2022, the parent row 'Public sector debt 1/' is 110.4 percent of GDP and its indented 'of which: external debt' row is 49.2 percent of GDP.
The table's definition box explicitly states that external/domestic debt is 'Residency-based'; therefore the calculated external share is an explicit proxy, not a direct currency-based FX share.
Coverage footnote 1 states: 'The central government, central bank, government-guaranteed debt.' This establishes a central-government base perimeter with the central bank and guarantees included.
The coverage footnote does not include nonguaranteed SOE debt.
How it was readBulk live read codex_cli/gpt-5.6-sol, prompt dsa-fxshare-report-pages-v3. Candidate page image sha256=adec6eb22ce514fb78aa41e12ac4829275cbedf424d8395e60596106a2467f1a.
Visible arithmetic: 24.2 / 51.8 × 100 = 46.72 percent of total debt.
Evidence
PDF page 116 (printed page 24), Table 2 reports actual 2024 public sector debt of 51.8 percent of GDP and the subordinate row 'of which: external debt' at 24.2 percent of GDP.
The table's coverage footnote states: 'The central, state, and local governments,' establishing a general-government perimeter and excluding the central bank from the stated coverage.
The table explicitly labels the definition of external debt as 'Currency-based,' so the external-debt component is a direct foreign-currency measure rather than a residency proxy.
How it was readBulk live read codex_cli/gpt-5.6-sol, prompt dsa-fxshare-report-pages-v3. Candidate page image sha256=dad9820b2708ffda94ebe08c7eff1ae75c323c3e8b908d0b9487bb5960e832b2.
Visible arithmetic: At the 2024 actual point on PDF page 55, the foreign-currency stack is absent, the local-linked layer is zero, and total debt is positive. Therefore 100 x 0 / positive total = 0 percent.
Evidence
Evidence: PDF page 55 (printed page 50) is an explicit Debt by Currency chart with a general-government perimeter and 2024 as the latest actual year before projections.
The canonical vector chart has no foreign-currency area series in the debt stack and the local-linked vector layer is zero in 2024. Staff commentary directly states that public debt is issued in local currency.
PDF page 54 (printed page 49) selects general-government coverage and excludes the central bank, public nonfinancial corporations, and other public financial corporations. It does not establish guarantee inclusion.
The governing-law panel on page 55 is not used as currency evidence. PDF pages 7, 19, and 20 contain report contents and fiscal or financial-sector context.
Manual source adjudication of an automatic invalid-arithmetic abstention. The source commentary says public debt is issued in local currency and the foreign-currency vector series is absent from the positive stack. The zero is recorded with a +/-0.1 percentage-point figure tolerance and medium confidence; no gate was changed.
Method: the calculation and evidence for Marshall Islands
Calculation
Visible arithmetic: The source states that 100 percent of covered debt is U.S.-dollar denominated, and the DSA chart classifies that stock as foreign-currency debt. Therefore foreign-currency debt / total covered debt x 100 = 100.0 percent.
Evidence
Evidence: PDF page 73 (printed page 3) states that RMI uses the U.S. dollar as legal tender and that RMI's debt is entirely denominated in U.S. dollars.
The same page states that the DSA covers central-government debt and government-guaranteed debt. Its coverage checklist leaves central-bank and non-guaranteed SOE debt unchecked.
PDF page 74 states that RMI has had no domestic debt since FY2021.
PDF page 91 (printed page 21), Table 2, reports FY2024 actual public-sector debt of 17.3 percent of GDP and external debt of 17.3 percent of GDP.
Table 2's currency-composition chart visually classifies the full covered stock as foreign-currency denominated. No approximate figure value is needed because the text states the entire stock is U.S.-dollar denominated.
The table separately labels external debt on a residency basis and says the residency and currency criteria materially differ; the direct result therefore rests on the text and currency chart, not on the external-debt row.
The report directly states that RMI's covered debt is entirely U.S.-dollar denominated. The DSA currency-composition chart classifies that full stock as foreign-currency debt. This is direct currency evidence, not the residency proxy.
Method: the calculation and evidence for Mauritania
Calculation
Visible arithmetic: US$4,067.7 million / US$4,798.4 million x 100 = 84.7720 percent, which rounds to the table's printed 84.8 percent. The 84.6 result from 36.9 / 43.6 uses rounded GDP ratios and is less precise.
Evidence
Evidence: PDF page 49 (printed page 42), Table 10, reports end-2024 total PPG debt of US$4,798.4 million and external debt of US$4,067.7 million.
The table directly reports external debt at 84.8 percent of total debt and states that its debt coverage is the same as the DSA.
PDF page 105 defines external debt as borrowing from or debt service payable to nonresidents, establishing a residency basis.
PDF page 129 (printed page 20), Table 3, confirms 2024 actual public-sector debt of 43.6 percent of GDP and external debt of 36.9 percent of GDP, defines debt on a residency basis, and says there is no material difference between the two criteria.
Table 3 footnote 1 covers central government, central bank, and government-guaranteed debt. Non-guaranteed SOE debt is not listed in the DSA perimeter.
Use the exact end-2024 debt-stock amounts and the table's directly reported percent-of-total column. This is more precise than recomputing from the one-decimal GDP ratios in Table 3. Retain only as a residency proxy.
Method: the calculation and evidence for Mauritius
Calculation
Visible arithmetic: approximately 17 / 85 × 100 = 20.0 percent of total debt. This is currency-based and is not an external-debt proxy.
Evidence
PDF page 49 (printed page 45) directly labels the upper panel “Debt by Currency (in percent of GDP)” and separates “Foreign currency” from “Local currency.”
The panel’s coverage note states: “The perimeter shown is nonfinancial public sector,” establishing debt_perimeter=nfps.
The projection marker begins after the 2024 observation; therefore 2024 is the latest visibly historical actual year.
From the plotted 2024 values, foreign-currency debt is approximately 17 percent of GDP and total debt is approximately 85 percent of GDP.
How it was readBulk live read codex_cli/gpt-5.6-sol, prompt dsa-fxshare-report-pages-v3. Candidate page image sha256=12563ebea365a374ce5c8f89adb887d4d8f00d67d4e5fdf739f7c11dc4bc4534.
Visible arithmetic: 13.0 / 58.3 × 100 ≈ 22.3 percent of total public debt. This is a figure-derived estimate, not a residency or governing-law proxy.
Evidence
Figure 7's 'Debt by Currency (Percent of GDP)' directly separates public debt into 'Foreign currency,' 'Local currency,' and 'Local-linked,' establishing a currency basis.
The figure's coverage note states: 'The perimeter shown is consolidated public sector,' supporting debt_perimeter=public_sector.
The latest point before the visibly marked projection period is 2024. The foreign-currency layer is approximately 13.0 percent of GDP; page 15 separately states gross public debt was 58.3 percent of GDP in 2024.
How it was readBulk live read codex_cli/gpt-5.6-sol, prompt dsa-fxshare-report-pages-v3. Candidate page image sha256=46f0bbb90480930317d6f84f5e0a57ee46aa49a377823d4c8bdcb2a8a2556677.
Method: the calculation and evidence for Micronesia, Federated States of
Calculation
Visible arithmetic: US$54.7 million external debt / US$58.0 million total debt x 100 = 94.3103 percent, which rounds to 94.3 percent.
Evidence
Evidence: Text Table 2 on PDF page 64 (printed page 3) reports Jun-23 total national-and-state-government debt of US$58.0 million and external debt of US$54.7 million.
The coverage text defines external debt using the residency criterion, so 94.3 percent is retained only as a residency proxy rather than relabeled as a currency measure.
PDF page 72 states that residency and currency criteria materially differ; its currency chart does not provide precise numeric labels that support a direct FX-share value.
The coverage pages establish national and state governments plus guarantees, no central bank, and no non-guaranteed SOE debt.
Retain 94.3 percent only as an explicit residency proxy. Direct currency composition remains unquantified; the currency chart is not precise enough to support a numeric inference.
Visible arithmetic: 4,309.9 / 6,795.2 x 100 = 63.43 percent, consistent with the table's 63.4 percent; 24.6 / 38.8 x 100 = 63.40 percent.
Evidence
Evidence: PDF page 79, Text Table 2, reports 2024 total debt of 6,795.2 million, 100.0 percent of total debt and 38.8 percent of GDP; external debt is 4,309.9 million, 63.4 percent of total debt and 24.6 percent of GDP.
PDF page 76 defines external debt by residency and describes public debt as covering central government, local authorities, public entities, guaranteed debt, state and municipal SOEs, and central-bank IMF debt.
PDF page 94 confirms 2024 public-sector debt of 38.8 percent of GDP and external debt of 24.6 percent of GDP, labels the definition residency-based, and says the criteria differ materially.
PDF page 94 footnote 1 explicitly includes central, state, and local governments plus social security, central bank, government-guaranteed debt, and non-guaranteed SOE debt.
Text Table 2 reports 2024 external debt of 4,309.9 million, 63.4 percent of total debt and 24.6 percent of GDP, against total debt of 6,795.2 million and 38.8 percent of GDP. External debt is residency-based, so the share is retained only as a proxy.
Visible arithmetic: No reconstruction is needed. PDF page 53 directly reports 94 percent of total public debt. Applying the direct share to the separately reported 48-percent-of-GDP stock would imply 45.12 percent of GDP, but that derived component is not recorded as a source value.
Evidence
Evidence: PDF page 53 (printed page 48) paragraph 3, directly states that foreign-currency-denominated debt accounts for 94 percent of total public debt, including the PBOC swap.
Paragraph 4 on the same page reports public debt at 48 percent of GDP in 2024, making 2024 the latest actual observation associated with the direct share.
Paragraph 2 and its footnote state that SRDSF coverage includes general-government debt, Development Bank of Mongolia debt, explicit SOE-debt guarantees, legacy Ministry of Finance debt against the Bank of Mongolia, the PBOC-BOM swap, and Trade and Development Bank debt.
PDF page 57 (printed page 52) selects general-government coverage but includes public nonfinancial corporations, the central bank, and other public financial corporations; its comments identify SOE guarantees and the PBOC swap. The inclusion flags preserve this broader stock.
PDF pages 35 and 36 are balance-of-payments and external-debt tables and were not treated as the FX-share measure. PDF page 58 visually triangulates the heavily foreign-currency debt composition.
Directly stated 2024 foreign-currency share of total public debt, including the PBOC swap. The selected DSA coverage is labeled general government but is explicitly broader through the included Development Bank of Mongolia, SOE guarantees, Bank of Mongolia swap liability, and other public financial corporation debt; the inclusion flags preserve that scope. No external-debt proxy or reconstructed numerator is used.
Method: the calculation and evidence for Montenegro
Calculation
PDF page 6 reports 2024 general government gross debt of 60.8 percent of GDP. Using the same general-government perimeter, the visible arithmetic would be approximately 8.0 / 60.8 × 100 = 13.2 percent, but the direct share is left null because the FX numerator is only graphically estimated.
Evidence
The currency chart visibly separates debt into “Foreign currency,” “Local currency,” and “Local-linked,” establishing a currency basis.
The figure’s coverage note states: “The perimeter shown is general government.”
The projection marker begins after the 2024 observation, making 2024 the latest visibly historical actual year.
At 2024, the foreign-currency area is approximately 8 percent of GDP based on the chart scale; this is a visual figure estimate rather than a labeled datapoint.
How it was readBulk live read codex_cli/gpt-5.6-sol, prompt dsa-fxshare-report-pages-v3. Candidate page image sha256=17625dbb0d45c6ffea26b40a033d4a87328280a467424bb608492c92712f147b.
Visible arithmetic: 18.5 ÷ 65 × 100 ≈ 28.5 percent of total debt.
Evidence
The upper chart directly separates debt into “Foreign currency,” “Local currency,” and “Local-linked,” establishing a currency basis.
The latest historical point is 2025; the chart’s projection segment begins after that point.
At 2025, the chart visibly indicates foreign-currency debt of approximately 18.5 percent of GDP and total debt of approximately 65 percent of GDP.
The coverage note directly below the chart states: “The perimeter shown is central government.”
The commentary describes a relatively low share of FX-denominated debt, consistent with the plotted currency composition.
How it was readBulk live read codex_cli/gpt-5.6-sol, prompt dsa-fxshare-report-pages-v3. Candidate page image sha256=f6823b902495630493062b92b93c57f4463cfec31e0a42535c6650368162caf0.
Method: the calculation and evidence for Mozambique
Calculation
Visible arithmetic: 60.9 / 89.9 × 100 = 67.74 percent of total public-sector debt.
Evidence
In Table 2, the latest historical column marked “Actual” is 2024; 2025 onward is under “Projections.”
For 2024, the parent row “Public sector debt 1/” is 89.9 percent of GDP and its indented “of which: external debt” row is 60.9 percent of GDP.
The table’s definition box states that external/domestic debt is “Currency-based” and that there is no material difference between the two criteria, so the currency-based external component is direct FX-share evidence rather than a residency proxy.
Footnote 1 states coverage of debt of the central government, central bank, government-guaranteed debt, and non-guaranteed SOE debt, supporting public_sector perimeter and inclusion flags y/y/y.
How it was readBulk live read codex_cli/gpt-5.6-sol, prompt dsa-fxshare-report-pages-v3. Candidate page image sha256=99e019515521af7542356ae2446b4e33342a0dd222c7f721586e8aa044edab76.
Visible arithmetic: (US$27.6 billion total debt - US$16.7 billion domestic debt) / US$27.6 billion x 100 = 39.4928 percent, which rounds to the reported 39.5 percent. Equivalently, 100.0 - 60.5 = 39.5.
Evidence
Evidence: PDF page 40 (printed page 3) states that total public debt was estimated at 38.6 percent of GDP as of end-June 2020 and that PPG external debt represented 39.5 percent of total public debt.
Text Table 1 on the same page reports total public debt of US$27.6 billion and domestic debt of US$16.7 billion, equal to 60.5 percent of total debt.
The page's footnote states that Myanmar's external-debt definition is based on residency.
PDF page 39 states that the DSA uses fully consolidated public-sector debt, government-guaranteed debt, social security, and central-bank debt, and that SOEs cannot borrow externally by law, so there is no non-guaranteed SOE debt in practice.
PDF page 53 reports the earlier 2019 actual parent-child values of 38.8 and 14.8 percent of GDP. The end-June 2020 decomposition is the later visible observation and therefore controls.
The end-June 2020 debt decomposition is later than the 2019 actual column used by the model. It directly reports domestic debt at 60.5 percent of total debt, leaving a 39.5 percent residency-based external share.
Visible arithmetic: No reconstruction is required: the source directly states the end-2025 foreign-currency share as about 12 percent of total debt.
Evidence
Evidence: PDF pages 2 and 3 establish the Namibia 2026 Article IV report identity; PDF page 8 is the contents page and supplies no competing debt observation.
PDF page 23, printed page 18, paragraph 21 directly states that the share of foreign-currency debt fell to about 12 percent at end-2025 after Eurobond repayment.
PDF page 23 footnote 15 states that non-Rand-denominated foreign debt was 2 percent of total government debt at end-2025. This corroborates the currency basis and shows that the broader 12 percent measure is not an external-debt proxy.
PDF page 49, printed page 44, Figure 3 names the Debt by Currency carrier and labels its perimeter central government. Its commentary says part of external debt is issued in rand, reinforcing that external and foreign-currency measures are not interchangeable.
PDF page 52 is the medium-term risk assessment and provides no later or competing direct currency share.
Paragraph 21 directly states that foreign-currency debt was about 12 percent at end-2025. Figure 3 supplies the required named currency carrier and central-government perimeter. Government guarantees are discussed separately from the carrier. The schema-reference field is repaired without changing schema v0 or any validation gate.
Visible arithmetic: 9.7 / 17.4 × 100 = 55.75 percent of total debt.
Evidence
Figure 3 explicitly labels its upper panel “Debt by Currency (Percent of GDP)” and distinguishes Foreign currency, Local currency, and Local-linked debt.
The figure’s coverage note states: “The perimeter shown is general government.”
FY2024 is the latest historical actual before the figure’s projection segment.
The FY2024 values visible in Table 5 on PDF page 33 are total government debt of 17.4 percent of GDP and external debt of 9.7 percent of GDP; these align with the FY2024 foreign-currency and total levels plotted in Figure 3.
The figure commentary describes the official debt as foreign-currency denominated, supporting a currency (not residency or governing-law) basis.
How it was readBulk live read codex_cli/gpt-5.6-sol, prompt dsa-fxshare-report-pages-v3. Candidate page image sha256=634b7c068085db20baf394c63d9b66c36690ee3b90fdf200f119dc8abc48a804.
Visible arithmetic: 10,545 / 21,417 x 100 = 49.235 percent, which rounds to the table's directly reported 49.2 percent. The 23.7 / 48.1 GDP-component ratio rounds to 49.3 only because both GDP inputs are already rounded, so it is not used over the direct stock share.
Evidence
Evidence: PDF page 129, Text Table 2, reports 2025 total debt of US$21,417 million, 100.0 percent of total debt and 48.1 percent of GDP; external debt is US$10,545 million, 49.2 percent of total debt and 23.7 percent of GDP.
PDF page 130 states that all domestic public debt is held by residents and that currency-based and residency-based measures are not expected to diverge significantly; it does not provide a direct currency-denomination share.
PDF pages 143 and 144 label the DSA external/domestic definition residency-based and state that the criteria do not differ materially.
PDF page 144 footnote 1 defines coverage as general government, central bank, and government-guaranteed debt.
PDF page 120 contains reporting requirements rather than a debt-composition observation, and PDF page 49 is a balance-of-payments table; neither is used for the reviewed value.
Text Table 2 directly reports the 2025 external share as 49.2 percent of total debt and 23.7 percent of GDP, against total debt of 48.1 percent of GDP. The DSA is residency-based, so the direct table share is retained only as an explicit proxy. The table year 2025 denotes FY2024/25.
Method: the calculation and evidence for Netherlands
Calculation
Visible arithmetic: At 2024, the foreign-currency vector is exactly 0.0 percent of GDP and the currency-chart total is positive; 100 x 0.0 / positive total = 0.0 percent of total debt.
Evidence
Evidence: PDF page 56 (printed page 51) is an explicit Debt by Currency chart. Its panel-specific note says the perimeter is consolidated public sector, and its commentary says public debt is in domestic currency.
The canonical vector path for foreign currency returns to the zero baseline by 2024. The local-linked path is degenerate at zero at the same point, while the local-currency stack remains positive.
PDF page 55 records the underlying DSA coverage as general government and excludes the central bank and public nonfinancial corporations. This is an internal perimeter-label inconsistency, so the reviewed record preserves the selected currency carrier's own public-sector label while using the coverage page only for explicit inclusion flags.
PDF page 44 reports the 2024 general-government debt stock, but that denominator was not substituted for the carrier-specific currency perimeter. PDF pages 21 and 27 provide fiscal and pension context, not currency composition.
Manual source adjudication of an automatic invalid-arithmetic abstention. The canonical vector chart proves an exact zero foreign-currency component at the latest actual point. The zero is recorded with a +/-0.1 percentage-point figure tolerance; confidence remains medium under schema v0's figure-read cap, and no gate was changed.
Method: the calculation and evidence for Nicaragua
Calculation
Visible arithmetic: 36.0 / 45.1 x 100 = 79.8226 percent, which rounds to 79.8 under the dataset's one-decimal convention.
Evidence
Evidence: PDF page 85 (printed page 3), Text Table 2, reports 2024 public-sector debt of 45.1 percent of GDP and public-sector external debt including guarantees of 36.0 percent of GDP.
PDF page 6 independently reports 2024 non-financial public-sector debt of 45.1 percent of GDP and external public debt of 36.0 percent of GDP.
PDF page 84 explicitly states that the DSA is conducted on a residency basis.
The same coverage page states that the DSA includes consolidated debt of the budgetary central government, local government, guaranteed SOE debt, and the Central Bank of Nicaragua.
PDF page 84 states that no non-guaranteed SOE debt is recorded and that non-guaranteed SOE debt is outside the reported perimeter.
No IDS or other non-DSA external-debt carrier is used.
Latest actual is 2024. Apply the one-decimal convention to the visible total and external debt ratios. The DSA is explicitly residency-based, so retain only as a proxy.
Cross-provider blind-audit correction. PDF page 128 (printed page 23), Table 2, reports 2024 actual public-sector debt of 47.7 percent of GDP and external debt of 27.0 percent of GDP. The definition box and footnote identify the external-debt row as currency-based. Visible arithmetic: 27.0 / 47.7 × 100 = 56.6 percent, matching the report's separately rounded statement that external debt was 57 percent of total debt. Coverage is central government, central bank, and government-guaranteed debt.
This row carries no separate arithmetic clause. The derivation is described in the evidence below.
Evidence
In the 2025 Est. column under Consolidated government operations, the parent row “Public gross debt 2/” is 36.1 percent of GDP and its indented “Of which: FX denominated debt” row is 16.9 percent of GDP.
The FX share is 16.9 / 36.1 × 100 = 46.81 percent of total public gross debt.
Footnote 2 states that gross debt figures for the Federal Government and the public sector include overdrafts from the Central Bank of Nigeria (CBN), supporting the public-sector perimeter. This does not establish that the central bank itself is inside the debtor perimeter.
The measure is explicitly FX-denominated debt, so the definition basis is currency and the observation is not a proxy.
How it was readBulk live read codex_cli/gpt-5.6-sol, prompt dsa-fxshare-report-pages-v3. Candidate page image sha256=a213d88d5995f5a8f113fa4d9ee75ea2590ea26c2b2bd9c944581d5fd7a9e0a1.
Method: the calculation and evidence for North Macedonia
Calculation
Visible arithmetic: approximately 34.5 ÷ 52.5 × 100 = 65.7 percent of total debt.
Evidence
The upper chart is explicitly titled “Debt by Currency (Percent of GDP)” and separates Foreign currency, Local currency, and Local-linked debt.
The chart note explicitly states: “The perimeter shown is general government.”
The projection marker begins after the 2025 observation, so 2025 is the latest visibly supported historical actual year.
For 2025, the foreign-currency area is approximately 34.5 percent of GDP, while the full stacked debt level is approximately 52.5 percent of GDP. The latter is also visibly reported as 52.5 in the 2025 “Gross general government debt” row on PDF page 28.
Local-linked debt is displayed as a separate currency category, supporting domestic_fx_linked_flag=y; it is not included in the reported foreign-currency numerator.
How it was readBulk live read codex_cli/gpt-5.6-sol, prompt dsa-fxshare-report-pages-v3. Candidate page image sha256=531cbedccea884403f1d56c8d89289e7c23a026867af33f4742847f5c8d362e3.
Visible arithmetic implies an approximate FX share of 16.5 / 42.5 × 100 = 38.8 percent, but the direct-share field is left null because both inputs are figure estimates and the pipeline will compute the share.
Evidence
PDF page 43 (printed page 37) contains Annex I, Figure 3, whose upper panel is explicitly titled “Debt by Currency (Percent of GDP).”
The coverage note directly below that panel states: “The perimeter shown is general government.”
The projection marker begins at 2025, so 2024 is the latest visibly historical actual year.
Reading the stacked areas at 2024 gives approximately 16.5 percent of GDP in foreign-currency debt and approximately 42.5 percent of GDP in total debt.
How it was readBulk live read codex_cli/gpt-5.6-sol, prompt dsa-fxshare-report-pages-v3. Candidate page image sha256=62bd0ce9e57b82d69b3ff2d95390dd158718345eeac24b731e674b34584ea28f.
Visible arithmetic: 25.0 / 36.0 × 100 ≈ 69.4 percent of total debt. Values are figure estimates rather than printed datapoints.
Evidence
The top panel is explicitly labeled “Debt by currency, percent of GDP,” establishing a currency basis.
The panel legend separates Foreign currency, Local currency, and Local-linked debt.
The note directly below the panel states: “The perimeter shown is general government.”
The projection marker begins after the 2024 observation, making 2024 the latest visibly historical actual year.
From the stacked chart at 2024, foreign-currency debt is approximately 25 percent of GDP and total debt is approximately 36 percent of GDP.
How it was readBulk live read codex_cli/gpt-5.6-sol, prompt dsa-fxshare-report-pages-v3. Candidate page image sha256=0d5a31a3217b85e1d1255d3202bbdd5021f3c8478727a2e245beb8eb7f1f5e0a.
Visible arithmetic: approximately 25.0 / 72.0 × 100 = 34.7 percent of total debt.
Evidence
The top panel is directly labeled “Debt by Currency (Percent of GDP)” and separates “Foreign currency” from “Local currency.”
The note under the panel states: “The perimeter shown is general government.”
The latest visibly historical point is 2025, immediately before the projection segment, at approximately 25 percent of GDP in foreign-currency debt and 72 percent of GDP in total debt.
This is a currency-based observation, not an external-debt residency or governing-law proxy.
How it was readBulk live read codex_cli/gpt-5.6-sol, prompt dsa-fxshare-report-pages-v3. Candidate page image sha256=f4c6f1d5cf805f8910e773a52439c531b88da5fbc69df1e35b099ced0a2c7fc6.
Visible arithmetic: At 2024, the foreign-currency layer is exactly 0.0 percent of GDP and the consolidated-public-sector currency-chart total is positive; 100 x 0.0 / positive total = 0.0 percent of total debt.
Evidence
Evidence: PDF page 52 (printed page 46) is an explicit Debt by Currency carrier. Its panel-specific note states that the perimeter is consolidated public sector.
At the 2024 actual point, the canonical chart has a positive local-currency stack and no foreign-currency or local-linked layer. The commentary says Palau's external multilateral debt is denominated in domestic currency, the U.S. dollar.
PDF page 51 selects public-sector coverage, includes public nonfinancial and other public financial corporations, and excludes the central bank because Palau has no central bank. The page separately says the SRDSA coverage is general government, so the reviewed record preserves the selected currency carrier's own perimeter label and uses the coverage page only for explicit inclusion flags.
PDF page 53 reports positive 2024 public debt of 63.3 percent of GDP and zero foreign-currency debt service. Debt service was used only as corroboration.
PDF pages 6, 9, 10, 12, 29, and 44 do not supply a competing public-debt currency observation.
Manual source adjudication of a model abstention. The explicit debt-by-currency carrier has a positive local-currency stack and exact zero foreign-currency and local-linked layers at the 2024 actual point. The zero is recorded with a +/-0.1 percentage-point figure tolerance; confidence remains medium under schema v0's figure-read cap, and no extraction gate was changed.
Visible arithmetic: At 2024, the foreign-currency layer is exactly 0.0 percent of GDP and the nonfinancial-public-sector currency-chart total is positive; 100 x 0.0 / positive total = 0.0 percent of total debt.
Evidence
Evidence: PDF page 77 (printed page 71) is an explicit Debt by Currency carrier. Its panel-specific note states that the perimeter is nonfinancial public sector.
At the 2024 actual point, the foreign-currency and local-linked layers are absent while the local-currency stack is positive. The commentary explains that Panama is dollarized and has issued mostly U.S. dollar-denominated debt, which the carrier classifies as local currency.
PDF page 76 selects nonfinancial-public-sector coverage, excludes the central bank, and includes public nonfinancial corporations. It also notes that some named public enterprises and non-consolidated agencies are outside the perimeter.
PDF page 78 reports positive 2024 public debt and zero foreign-currency debt service. Debt-service currency was used only as corroboration, not as the stock numerator.
PDF pages 6 and 52 report external debt, and PDF pages 70 and 72 discuss external debt. None was treated as equivalent to debt by currency.
Manual source adjudication of a model abstention. The explicit debt-by-currency carrier has a positive local-currency stack and exact zero foreign-currency and local-linked layers at the 2024 actual point. The zero is recorded with a +/-0.1 percentage-point figure tolerance; confidence remains medium under schema v0's figure-read cap, and no extraction gate was changed.
Method: the calculation and evidence for Papua New Guinea
Calculation
This row carries no separate arithmetic clause. The derivation is described in the evidence below.
Evidence
PDF page 129 (printed page 18) shows 2025 under the table's Actual columns: “Public sector debt” = 52.6 percent of GDP and its subordinate “of which: external debt” row = 28.9 percent of GDP.
The visible classification box states “Definition of external/domestic debt: Currency-based” and says there is no material difference between the two criteria, so the external component is usable as a direct foreign-currency measure rather than a residency proxy.
Preserving the hierarchy, the foreign-currency share is 28.9 / 52.6 × 100 = 54.94 percent, reported as 54.9 percent of total debt.
Coverage footnote 1 states: “Coverage of debt: The central, state, and local governments, government-guaranteed debt.” This supports a general-government base perimeter and inclusion of guarantees.
How it was readBulk live read codex_cli/gpt-5.6-sol, prompt dsa-fxshare-report-pages-v3. Candidate page image sha256=78992f90005abd612bb5f19160ef5d87a4118f422b269b547bacb583b031d573.
Visible arithmetic: The exact 2024 table components are 38.1 percent of GDP foreign-currency debt and 44.8 percent of GDP total public-sector debt; 100 x 38.1 / 44.8 = 85.0446 percent, rounded to 85.0 percent.
Evidence
Evidence: PDF page 30 (printed page 26), Table 3, reports 2024 public sector debt excluding Central Bank bills of 44.8 percent of GDP and an exact foreign-currency component of 38.1 percent of GDP.
PDF page 43 (printed page 39) reconciles the DSA debt total to 44.8 percent of GDP and says the DSA adds government-guaranteed debt plus selected liabilities of the central bank and state-owned companies. The selected total excludes Central Bank bills but includes specified BCP liabilities.
PDF page 46 (printed page 42) repeats 44.8 percent of GDP as the 2024 actual public-debt stock and identifies 6.4 percent of GDP as government-guaranteed debt.
PDF page 47 (printed page 43) is the matching Debt by Currency figure for general government and shows foreign currency as the dominant 2024 layer with no visible local-linked layer.
PDF page 44 (printed page 40) says foreign-currency-denominated debt is around 85 percent of total public debt, corroborating the exact table arithmetic.
Other pages concerning bank deposits, bank credit, or general local-currency issuance were not treated as the public-debt FX measure.
Manual source adjudication of a model abstention. The source table reports exact 2024 foreign-currency and total public-sector debt components on the same row set. The DSA pages reconcile the 44.8 percent total and document included guarantees, selected central-bank liabilities, and state-owned-company liabilities. No extraction gate was changed.
This row carries no separate arithmetic clause. The derivation is described in the evidence below.
Evidence
Table 7 on PDF page 46 reports 2025 actual Public sector debt/GDP of 30.2 percent and an indented 'Of which: in domestic currency' value of 17.3 percent of GDP; 2026 onward is explicitly under Projections.
Foreign-currency debt is the visible currency complement: 30.2 − 17.3 = 12.9 percent of GDP. Its share of total debt is 12.9 ÷ 30.2 × 100 = 42.72 percent.
PDF page 56 states that the Non-Financial Public Sector is the statistical coverage of Peru's public debt statistics, establishing the NFPS perimeter.
The selected-economic-indicators page labels the same 2025 debt aggregate 'Gross non-financial public sector debt' at 30.2 percent of GDP and states in footnote 7 that it includes government-guaranteed debt.
How it was readBulk live read codex_cli/gpt-5.6-sol, prompt dsa-fxshare-report-pages-v3. Candidate page image sha256=23458e304ea05f2394a1b87c5102280456b680e7568c8cbcab18fc0455a5a7e3.
Method: the calculation and evidence for Philippines
Calculation
Visible arithmetic: The same-axis 2024 currency stack reads approximately 19.3 percent of GDP foreign currency against 60.7 percent of GDP total public debt; 100 x 19.3 / 60.7 = 31.8 percent after one-decimal rounding.
Evidence
Evidence: PDF page 61 (printed page 55) is an explicit Debt by Currency carrier and states that the perimeter is central government.
The 2024 actual stack has an approximately 19.3 percent-of-GDP foreign-currency layer and a positive total. No local-linked layer is visible at that point.
PDF page 62 (printed page 56) gives the matching 2024 public-debt total as 60.7 percent of GDP. The calibrated currency-chart ratio is 31.8 percent.
PDF page 60 selects central-government coverage, excludes every non-central-government subsector, and describes the stock as national-government debt. Guarantees are not established by the visible coverage fields.
PDF pages 48 and 54 report economy-wide external debt that includes public and private debt. Those values were not substituted for the selected public-debt currency carrier.
Manual source adjudication of a model abstention. The explicit debt-by-currency carrier yields 31.8 percent after same-axis calibration of the 2024 foreign-currency layer against the positive total stack. The value is recorded with a +/-0.1 percentage-point figure tolerance; confidence remains medium under schema v0's figure-read cap, and no extraction gate was changed.
Visible arithmetic: 14.0 ÷ 55.1 × 100 ≈ 25.4 percent of total general-government debt. This is a currency-based measure, not an external-debt residency or governing-law proxy.
Evidence
PDF page 48 (printed page 42) directly labels the top panel “Debt by Currency (Percent of GDP)” and identifies the light-blue component as “Foreign currency.”
The panel’s note explicitly states: “The perimeter shown is general government.”
The projection marker begins after the 2024 observation, making 2024 the latest visibly historical year.
The 2024 foreign-currency component is approximately 14.0 percent of GDP from the figure. The visible Table 1 reports exact 2024 general government debt of 55.1 percent of GDP.
How it was readBulk live read codex_cli/gpt-5.6-sol, prompt dsa-fxshare-report-pages-v3. Candidate page image sha256=aa6b26e4da0f9e36cb9d35b766aac5b78a312558cccf221ab3a815c7b61e4f5e.
Visible arithmetic: At 2025, the foreign-currency layer is exactly 0.0 percent of GDP and the consolidated-public-sector currency-chart total is positive; 100 x 0.0 / positive total = 0.0 percent of total debt.
Evidence
Evidence: PDF page 49 (printed page 45) is an explicit Debt by Currency carrier. Its panel-specific note states that the perimeter is consolidated public sector.
At the latest actual point, 2025, the foreign-currency and local-linked layers are absent while the local-currency stack is positive. The commentary states that Portugal's debt is local-currency-denominated and not exposed to exchange-rate risk.
PDF page 48 reports positive 2025 public debt of 89.7 percent of GDP and zero foreign-currency debt service. Debt service was used only as corroboration.
PDF page 47 selects public-sector coverage, includes the central bank, and excludes public nonfinancial corporations. Guarantees are not established by the visible fields.
PDF pages 42 and 43 report economy-wide external debt and aggregate public debt. Those incompatible aggregates were not combined.
Manual source adjudication of a model abstention. The explicit debt-by-currency carrier has a positive local-currency stack and exact zero foreign-currency and local-linked layers at the 2025 actual point. The zero is recorded with a +/-0.1 percentage-point figure tolerance; confidence remains medium under schema v0's figure-read cap, and no extraction gate was changed.
This row carries no separate arithmetic clause. The derivation is described in the evidence below.
Evidence
The upper panel is directly labeled “Debt by Currency (Percent of GDP)” and distinguishes “Foreign currency,” “Local currency,” and “Local-linked.”
The coverage note directly below that panel states: “The perimeter shown is central government.”
The projection marker begins after the historical 2023 observation, making 2023 the latest visible actual year.
At 2023, the stacked chart visibly indicates foreign-currency debt of approximately 23 percent of GDP and total debt of approximately 43 percent of GDP. The implied FX share would be about 23 / 43 × 100 = 53.5 percent, but the component estimates are returned because the figure does not directly label the share.
How it was readBulk live read codex_cli/gpt-5.6-sol, prompt dsa-fxshare-report-pages-v3. Candidate page image sha256=d857cbbebad6acbae1bb521e8059c1559b74d4ec79668429b3529c61c8c6faef.
This row carries no separate arithmetic clause. The derivation is described in the evidence below.
Evidence
The top panel is explicitly labeled “Debt by Currency (Percent of GDP)” and separates Foreign currency, Local currency, and Local-linked debt.
The figure’s coverage note states: “The perimeter shown is general government.”
The projection marker begins after 2024, making 2024 the latest visibly historical observation.
For 2024, the stacked chart indicates foreign-currency debt of approximately 28.0 percent of GDP and total public debt of approximately 57.5 percent of GDP; the implied FX share is about 28.0 / 57.5 × 100 = 48.7 percent.
The figure explicitly includes a Local-linked category, although its 2024 amount is not separately readable; therefore domestic_fx_linked_flag is y and no direct total FX share is reported.
The callout corroborates the magnitude: “around half of public debt” is denominated in or linked to foreign currencies.
How it was readBulk live read codex_cli/gpt-5.6-sol, prompt dsa-fxshare-report-pages-v3. Candidate page image sha256=21d5b977edcace45009334753a1c84a931c80906dd86fdf93997faa54684f500.
Visible arithmetic: 59.3 / 73.6 × 100 = 80.57 percent of total public-sector debt.
Evidence
PDF page 95, Table 2 shows the latest actual year as 2025: “Public sector debt” = 73.6 percent of GDP and its indented “of which: external debt” row = 59.3 percent of GDP.
The table’s definition box explicitly states that external/domestic debt is “Currency-based,” so the external-debt component is direct foreign-currency debt rather than a residency proxy.
Table 2 footnote 1 states: “Coverage of debt: The entire public sector, including SOEs,” establishing the public-sector perimeter.
PDF page 82 states that the DSA covers guarantees and all SOE guaranteed and non-guaranteed debt; its coverage checklist also marks the central bank, guarantees, and non-guaranteed SOE debt as included.
How it was readBulk live read codex_cli/gpt-5.6-sol, prompt dsa-fxshare-report-pages-v3. Candidate page image sha256=e6e378c0389b403efd35c333793de16fcf0c4d305886b74233f76af6eab09906.
Visible arithmetic: foreign-currency share = 25.9 / 31.1 × 100 = 83.28 percent of total debt.
Evidence
PDF page 95, Table 2 reports 2024 actual public sector debt of 31.1 percent of GDP and the subordinate row 'of which: external debt' at 25.9 percent of GDP.
The table's coverage footnote states: 'The central government plus government-guaranteed debt,' establishing a central-government perimeter with guarantees included.
PDF page 76 states that all domestic debt, including government guarantees, is in tala and all external debt is in foreign currency; it explicitly says the residency-based classification is equivalent to the currency-based classification for Samoa.
PDF page 76 states non-guaranteed SOE debt is excluded from the baseline DSA, and its footnote states credit to the central bank under the IMF Rapid Credit Facility is not included in public debt.
How it was readBulk live read codex_cli/gpt-5.6-sol, prompt dsa-fxshare-report-pages-v3. Candidate page image sha256=28de1cd4ac65601a55be1a9d5741c46d9759bf70b2cd39b7ab847fd2807b20af.
Method: the calculation and evidence for San Marino
Calculation
Visible arithmetic: At 2024, foreign-currency debt is 0.0 percent of GDP and official central-government debt is 62.4 percent of GDP; 100 x 0.0 / 62.4 = 0.0 percent of total debt.
Evidence
Evidence: PDF page 62 (printed page 56) explicitly labels the selected carrier Debt by Currency and states that its perimeter is central government. The 2024 actual stack has a positive local-currency layer and degenerate zero foreign-currency and local-linked layers.
PDF page 6 reports 2024 Government debt (official) of 62.4 percent of GDP and defines it as central-government debt, matching the selected carrier's perimeter and endpoint.
PDF page 61 excludes the central bank and public nonfinancial corporations from the baseline coverage. It also states that non-central-government entities are insignificant for the selected central-government coverage.
PDF page 8 is the contents page and PDF page 10 is macro-fiscal narrative context; neither provides a competing currency measure.
Manual source adjudication of an automatic invalid-arithmetic abstention. The canonical vector chart proves an exact zero foreign-currency component in 2024, and the exact central-government total is reported separately on page 6. The zero is recorded with a +/-0.1 percentage-point figure tolerance; confidence remains medium, and no gate was changed.
Evidence limitation, disclosed: the report's text does not state the currency of issuance anywhere, so this zero rests on the chart evidence described above. The 2026-07-29 second-model verification pass rendered every page this row cites and, under the rule that a stated zero needs an explicit source statement, scored the row not confirmable; no evidence in any pass contradicted the value.
Method: the calculation and evidence for São Tomé and Príncipe
Calculation
Visible arithmetic: 286.8 / 540.3 x 100 = 53.082 percent, which rounds to the table's directly reported 53.1 percent. The rounded GDP components, 34.6 / 65.2, also round to 53.1 but are secondary to the direct stock share.
Evidence
Evidence: PDF page 81, Text Table 3, reports 2024 total PPG debt of US$540.3 million and external debt of US$286.8 million, with external debt directly shown as 53.1 percent of total debt.
PDF page 79 states that the DSA covers central government, central bank, and EMAE debt, applies a residency-based external-debt definition, and includes guarantees while leaving non-guaranteed SOE debt outside baseline coverage.
PDF page 79 also states that using the currency criterion would yield significantly different results because EMAE debt and arrears to ENCO are denominated in USD but classified as domestic debt under residency.
PDF page 88 confirms that EMAE arrears to ENCO are denominated in foreign currency and discusses the resulting currency risk; it does not disclose a complete currency-denomination share.
PDF page 97, Table 2, reports rounded 2024 GDP shares of 65.2 total and 34.6 external and labels the definition residency-based. PDF pages 7 and 29 are economic-indicator tables and do not provide a competing public-debt currency share.
Text Table 3 directly reports the 2024 external share as 53.1 percent of total PPG debt. The DSA is residency-based, so this is only a proxy. The report explicitly says EMAE debt and arrears to ENCO are USD-denominated but classified as domestic; domestic FX-linked debt is therefore present and the proxy understates the currency-based share.
Method: the calculation and evidence for Saudi Arabia
Calculation
Visible arithmetic: approximately 11 / 26.2 × 100 ≈ 42 percent of total central-government debt. This is a figure-derived estimate, so confidence is below high.
Evidence
PDF page 79 (printed page 73) explicitly labels the upper chart “Debt by Currency (Percent of GDP)” and its legend distinguishes “Foreign currency,” “Local currency,” and “Local-linked.”
The figure states: “The perimeter shown is central government.”
The projection marker begins after the 2024 observation, making 2024 the latest visibly historical actual year.
The 2024 foreign-currency layer is approximately 11 percent of GDP by visual reading of the chart. PDF page 6 reports 2024 public debt of 26.2 percent of GDP under “Central government finances.”
The separately plotted “Local-linked” category supports domestic_fx_linked_flag=y; it is not included in the foreign-currency numerator.
How it was readBulk live read codex_cli/gpt-5.6-sol, prompt dsa-fxshare-report-pages-v3. Candidate page image sha256=1b0ce6176c5f72de2c044631c6d538474c1ee7202a40ee7f88ef5c87dfdf3613.
Visible arithmetic: No component calculation is required because paragraph 6 directly reports 73.7 percent of total public-sector debt.
Evidence
Evidence: PDF page 116, paragraph 6, directly states that the share of external debt fell to 73.7 percent in 2022.
PDF page 114 states that the DSA uses a currency-based definition of external and domestic debt, making the 73.7 percent observation a direct FX share rather than a proxy.
PDF page 114 defines public-debt coverage as public and publicly guaranteed debt held by central government, para-public entities, and state-owned enterprises; it reports consolidated public debt of 76.6 percent of GDP in 2022.
PDF page 132 independently labels the external DSA definition currency-based and states that the currency and residency criteria differ materially.
PDF page 69 discusses valuation effects of foreign-currency debt but does not provide a stock share, while PDF page 107 concerns program definitions for new external debt and arrears; neither replaces the direct paragraph-6 observation.
Paragraph 6 directly states that external debt was 73.7 percent of total public-sector debt in 2022. The DSA explicitly uses a currency-based definition and a consolidated public-sector perimeter including para-public entities and SOEs.
Visible arithmetic implies an approximate FX share of 33.0 / 43.0 × 100 ≈ 76.7 percent; components are returned because the figure does not print an exact share.
Evidence
The top chart explicitly decomposes debt by currency into “Foreign currency,” “Local currency,” and “Local-linked,” establishing a currency basis.
The chart’s note states: “The perimeter shown is general government.”
The projection marker begins after the 2025 observation, so 2025 is the latest visibly historical, non-projected year.
At 2025, the foreign-currency area is approximately 33 percent of GDP and the full stacked debt area is approximately 43 percent of GDP, read against the chart’s 10-percentage-point vertical scale.
The legend includes a distinct “Local-linked” category, so domestic FX-linked debt is visibly recognized, although its amount is very small or zero in the displayed years.
How it was readBulk live read codex_cli/gpt-5.6-sol, prompt dsa-fxshare-report-pages-v3. Candidate page image sha256=6c19b36947a40cfc03e4ae919e63ef8d5563070c38669f3a4bc03220f6e28a8a.
Method: the calculation and evidence for Seychelles
Calculation
Visible arithmetic: No reconstruction is required because PDF page 25, paragraph 31, directly states that external debt represented 54 percent of total debt at end-2025. That statement is residency-based (the report's 'external debt' wording), so this row is recorded as an explicit residency proxy for the currency share (v0.1.4 metadata correction, signed 2026-07-30; value unchanged). Corroboration on the residency basis: PDF page 51, printed page 44, Table 9 reconciles to the statement once the guarantee memo items are added back: (649 + 14) / (1,164 + 61) = 54.1 percent. Corroboration on the currency basis: Annex V Figure 2 (PDF page 62) shows roughly 29 percent of GDP foreign-currency debt against 53.6 percent of GDP total debt at the 2025 historical endpoint, about 54 percent within figure tolerance, which is why this proxy is a reasonable default for the currency share.
Evidence
Evidence: PDF pages 3, 7, 8, and 11 establish the Seychelles report identity, publication context, and selected debt indicators; none provides a competing currency share.
PDF page 25, printed page 18, reports gross public debt of 53.6 percent of GDP at end-2025 and directly states that external debt represented 54 percent of total debt at end-2025.
PDF pages 40 and 42 contain external-sector and Fund-credit data rather than a public-debt currency-share carrier and are not substituted.
PDF page 51, printed page 44, Table 9 reports a 55.8-percent creditor-classified external share that excludes guarantees from the debt stock; that figure is not used directly, and with the guarantee memo items added back it reconciles to 54.1 percent, corroborating the paragraph-31 statement.
Additional canonical PDF page 61, printed page 54, is Annex V Figure 1, Debt Coverage and Disclosures. It selects general government, includes budgetary central government and social security funds, excludes the central bank and public corporations, and states that government guarantees are included in the debt coverage.
Additional canonical PDF page 62, printed page 55, is Annex V Figure 2, Public Debt Structure Indicators. Its top panel is directly labeled Debt by Currency, separates foreign currency, local currency, and local-linked debt, identifies 2025 as the last historical point before projection, and states that the perimeter is general government.
The Figure 2 commentary discusses the share of foreign debt in the same public-debt structure context as the currency panel; the chart is consistent with a currency-basis share near 54 percent, while the paragraph-31 statement itself uses the report's 'external debt' wording.
Verification history: the 2026-07-29 directions-following run (verifiers from two model families across two passes) read paragraph 31 as a residency share and reconciled it to Table 9, which is why the basis label was corrected. Confidence remains medium.
Method: the calculation and evidence for Sierra Leone
Calculation
Visible arithmetic: 1,977 / 3,238 x 100 = 61.056 percent, rounded to the table's directly reported 61.1 percent. The rounded DSA GDP components, 28.5 / 46.7, produce 61.0 and are not preferred over the direct stock share.
Evidence
Evidence: PDF page 38, Table 9, reports 2024 total debt of US$3,238 million and external debt of US$1,977 million, with external debt directly shown as 61.1 percent of total debt.
PDF page 85 states that the debt stock is on a residency basis and its coverage matrix marks central government, social security, guarantees, and central-bank borrowing on behalf of government, while non-guaranteed SOE debt is unmarked.
PDF page 86 states that approximately 61 percent of total PPG debt is external and that the remaining 39 percent is domestic.
PDF pages 103 and 104 label external/domestic debt residency-based and state that the criteria do not differ materially. Table 2 reports rounded 2024 GDP components of 28.5 external and 46.7 total.
PDF page 90 discusses financing assumptions, and PDF page 9 is the report's tables listing; neither supplies a competing historical currency share.
Table 9 directly reports 2024 external debt at 61.1 percent of total debt, supported by the stock ratio. The DSA is residency-based, so the share is retained only as a proxy. Social-security-fund coverage makes the base perimeter general government.
Method: the calculation and evidence for Singapore
Calculation
Visible arithmetic: At end-FY2024, foreign-currency debt is exactly 0.0 percent of GDP and total central-government debt is 173 percent of GDP; 100 x 0.0 / 173 = 0.0 percent of total debt.
Evidence
Evidence: PDF page 66 (printed page 61) explicitly labels the selected panel Debt by Currency and states: “The perimeter shown is central government.” This corrects the original model response, which labeled the carrier general government.
The page 66 commentary states that the debt-to-GDP ratio was 173 percent at end-FY2024 and that Singapore issues domestic, local-currency government securities. The canonical vector contains no positive foreign-currency layer at FY2024, and the local-linked path is also degenerate at zero.
PDF page 65 excludes the central bank and public nonfinancial corporations from baseline coverage. Its commentary also says the fiscal assumptions are based on central-government debt.
PDF pages 7, 26, and 54 provide report, policy, or holder context; PDF page 74 discusses data adequacy. None supplies a competing currency-denomination share.
Manual source adjudication of an automatic invalid-arithmetic abstention. The canonical vector chart and direct commentary support an exact zero for end-FY2024, and the reviewed perimeter corrects the model's general-government label to the currency panel's central-government label. The zero is recorded with a +/-0.1 percentage-point figure tolerance; confidence remains medium, and no gate was changed.
Method: the calculation and evidence for Slovak Republic
Calculation
This row carries no separate arithmetic clause. The derivation is described in the evidence below.
Evidence
Cross-provider blind-audit correction. PDF page 48 (printed page 43), Annex III Figure 3, is a direct Debt by Currency chart for the consolidated public sector. At the 2024 historical endpoint, the foreign-currency layer is visually indistinguishable from zero against a positive debt stock, and the figure commentary states that public debt is issued in euros. Record approximately 0.0 percent of total debt with medium confidence under the figure-read cap. A small component below the chart's reading precision cannot be ruled out.
The implied arithmetic is approximately 2.5 / 66 × 100 = 3.8 percent. The direct-share field is null because the page supplies GDP components and the pipeline will compute the share.
Evidence
The top panel is explicitly titled “Debt by currency (Percent of GDP)” and its legend distinguishes Foreign currency, Local currency, and Local-linked, establishing a currency basis.
The note directly below the panel states: “The perimeter shown is general government.”
The latest historical point before the projection period is 2024; the projection segment begins after that observation.
At the 2024 endpoint, the chart shows total debt at approximately 66 percent of GDP and the thin foreign-currency band at approximately 2.5 percent of GDP. These are visual figure estimates rather than printed labels.
How it was readBulk live read codex_cli/gpt-5.6-sol, prompt dsa-fxshare-report-pages-v3. Candidate page image sha256=a87569cc433b29547bbd407ce9b9ef7616b5d3f8165ba312fa87605d527d8c4d.
Method: the calculation and evidence for Solomon Islands
Calculation
Visible arithmetic: 11.7 / 20.3 x 100 = 57.635 percent, rounded to 57.6 percent.
Evidence
Evidence: PDF page 60, Text Figure 1, labels the public-debt composition as 'in foreign currency' and 'in domestic currency' through 2023.
The surrounding page-60 text reports end-2023 external PPG debt of 11.7 percent of GDP and total public debt of 20.3 percent of GDP.
PDF page 59 says the DSA uses a residency definition but that there is no material difference from the currency-based definition; it defines coverage as central-government debt, central-government-guaranteed debt, and central-bank debt borrowed on behalf of government, and explicitly excludes non-guaranteed SOE debt.
PDF page 61 reports 2023 creditor shares of 47.1 percent multilateral, 10.7 percent bilateral, and 42.2 percent government securities; separately rounded creditor shares are consistent with the approximately 57.6 percent foreign-currency component.
PDF pages 69 and 70 corroborate the 2023 external and total GDP components and the no-material-difference statement. PDF page 26 is a broader fiscal-indicators chart, and page 38 concerns capital and financial-account flows rather than public-debt currency composition.
Text Figure 1 explicitly decomposes 2023 public debt into foreign-currency and domestic-currency components. The surrounding text reports the foreign-currency-equivalent component at 11.7 percent of GDP and total public debt at 20.3 percent of GDP, yielding 57.6 percent. Confidence is medium because the currency labeling is carried by a figure.
Visible arithmetic: 1,049.3 / 1,117.2 x 100 = 93.922 percent, which rounds to the table's directly reported 93.9 percent. The rounded GDP components, 8.6 / 9.2, would produce 93.5 and are not used over the direct stock share.
Evidence
Evidence: PDF page 44, Table 13, reports end-2024 total public debt of US$1,117.2 million and external debt of US$1,049.3 million; the table directly reports external debt as 93.9 percent of total debt.
PDF page 86 states that the public-debt perimeter comprises central government and central bank, defines external debt on a residency basis, and reports no current government-guaranteed debt or known SOE liabilities. Its coverage matrix nevertheless marks guarantees and non-guaranteed SOE debt as formally covered.
PDF page 94, Table 2, reports 2024 public-sector debt of 9.2 percent of GDP and external debt of 8.6 percent, labels the definition residency-based, and footnote 1 identifies coverage as central government, central bank, government-guaranteed debt, and non-guaranteed SOE debt.
PDF page 101 repeats the creditor decomposition and supports the same 93.9 percent stock share. PDF pages 7, 27, and 93 contain the tables listing, fiscal operations, and external DSA context; none provides a competing direct currency share.
Table 13 directly reports the end-2024 external share as 93.9 percent of total public debt. The DSA defines external debt on a residency basis, so the value is retained only as an explicit proxy. The formal coverage matrix includes central government, central bank, government-guaranteed debt, and non-guaranteed SOE debt, although the narrative reports no current guaranteed debt or known SOE liabilities.
Method: the calculation and evidence for South Africa
Calculation
From the stacked chart, 2024 foreign-currency debt is approximately 8 percent of GDP and total debt approximately 76 percent of GDP. Visible arithmetic: 8.0 / 76.0 × 100 ≈ 10.5 percent of total debt.
Evidence
Figure 3 directly labels the relevant panel “Debt by Currency (Percent of GDP)” and separates “Foreign currency,” “Local currency,” and “Local-linked” debt.
The note beneath the panel explicitly states: “The perimeter shown is central government.”
The projection marker begins after the 2024 observation, making 2024 the latest visibly historical actual year.
The result is a figure-based estimate rather than a precisely tabulated observation.
How it was readBulk live read codex_cli/gpt-5.6-sol, prompt dsa-fxshare-report-pages-v3. Candidate page image sha256=79a4a8a09284dcfc13173c956403c6b61f78c247abb867ddf7129044c8e291d2.
Method: the calculation and evidence for South Sudan
Calculation
This row carries no separate arithmetic clause. The derivation is described in the evidence below.
Evidence
PDF page 89, Text Table 2 reports FY2022/23 Total debt of US$3,722.9 million, 100.0 percent of total debt, and 51.2 percent of GDP.
The same table reports the parent row External at US$2,528.6 million, 67.9 percent of total debt, and 34.8 percent of GDP. Thus the visible direct share is 67.9%; the components also verify it: 34.8 / 51.2 × 100 ≈ 68.0%, with the small difference explained by displayed rounding.
PDF page 88 explicitly states: 'External debt is defined using the currency criterion.' Therefore the External share is a direct currency-based FX share, not a proxy.
The DSA coverage table on PDF page 88 marks Central government and Central bank, and states the country's coverage as 'The central government, central bank.' This supports debt_perimeter=central_government and incl_central_bank=y.
PDF page 88 states that SOEs are omitted because information about SOE debt and government guarantees is incomplete or unavailable, supporting incl_nonguaranteed_soe=n.
Footnote 4 on PDF page 89 states that guaranteed debt is included in public debt, supporting incl_guarantees=y.
How it was readBulk live read codex_cli/gpt-5.6-sol, prompt dsa-fxshare-report-pages-v3. Candidate page image sha256=1fa1eb4bc07f95b77594f068659d0f3a9ff2ef56c147b5b9119f97474b362161.
Visible arithmetic: At 2025, foreign-currency debt is exactly 0.0 percent of GDP and the general-government currency-chart total is positive at about 100 percent of GDP; 100 x 0.0 / positive total = 0.0 percent of total debt.
Evidence
Evidence: PDF page 68 (printed page 63) explicitly labels the selected carrier Debt by Currency and states that its perimeter is general government.
The canonical vector chart has no positive foreign-currency path at the 2025 actual point; the entire positive stack is local currency. The local-linked path is degenerate at zero in 2025.
PDF page 67 establishes general-government coverage and excludes the central bank and public nonfinancial corporations; guarantees are not established by the visible coverage fields.
PDF page 55 states that 11.0 percent of total external debt is foreign-currency denominated. That denominator is external debt, not total public debt, so it was rejected as the DSA FX-share measure.
PDF pages 21 and 32 provide fiscal-policy and financial-sector narrative context, not a competing currency-composition measure.
Manual source correction of a low-confidence abstention. The canonical vector chart contains no positive foreign-currency layer at the 2025 actual point, and the local-linked path is also degenerate at zero. The exact zero is recorded with a +/-0.1 percentage-point figure tolerance; confidence remains medium under schema v0's figure-read cap, and no gate was changed.
Evidence limitation, disclosed: the report's text does not state the currency of issuance anywhere, so this zero rests on the chart evidence described above. The commentary's closest wording characterizes the debt as predominantly domestic-currency without stating a zero. The 2026-07-29 second-model verification pass rendered every page this row cites and, under the rule that a stated zero needs an explicit source statement, scored the row not confirmable; no evidence in any pass contradicted the value.
Method: the calculation and evidence for Sri Lanka
Calculation
Visible arithmetic: Approximately 42.0 percent-of-GDP foreign-currency debt / 105.0 percent-of-GDP total covered debt x 100 = approximately 40.0 percent of total debt.
Evidence
Evidence: PDF page 4 reports 2025 actual central-government and public-debt totals, but no matching currency component; the economy-wide public-and-private external-debt row is not used.
PDF pages 6, 8, 14, and 99 contain contents, acronyms, program-performance text, and monitoring text rather than a public-debt currency measure.
PDF page 49 (printed page 45), Figure 2, selects central-government DSA coverage and states that it includes central-government debt, central-government-guaranteed SOE debt, and central-bank liabilities from Fund credit and bilateral swaps; nonguaranteed SOE debt is not included.
PDF page 50 (printed page 46), Figure 3, directly separates Foreign currency and Local currency debt and notes a central-government perimeter. The latest pre-projection point is 2024, with the foreign-currency layer visibly about 42.0 percent of GDP.
PDF page 51 (printed page 47), Figure 4, reports 2024 preliminary public debt of exactly 105.0 percent of GDP under the same DSA.
Latest matching historical observation is 2024 preliminary. The foreign-currency layer is approximately 42.0 percent of GDP and total covered debt is 105.0 percent of GDP, giving approximately 40.0 percent of total debt.
Method: the calculation and evidence for St. Kitts and Nevis
Calculation
This row carries no separate arithmetic clause. The derivation is described in the evidence below.
Evidence
Figure 3's top panel is explicitly titled “Debt by Currency (Percent of GDP)” and separates Foreign currency, Local currency, and Local-linked debt.
The historical series ends in 2025; the projection portion begins in 2026, so 2025 is the latest visible actual observation.
At 2025, the stacked chart visibly indicates approximately 11 percent of GDP in foreign-currency debt and approximately 58 percent of GDP in total debt. The implied FX share is about 11 / 58 × 100 = 19 percent; values are figure estimates rather than printed data labels.
The same report's Figure 2 selects NFPS coverage and visibly includes budgetary central government, local governments, and public nonfinancial corporations, while excluding the central bank.
No Local-linked band is visible in the debt-by-currency stack, supporting domestic_fx_linked_flag=n.
How it was readBulk live read codex_cli/gpt-5.6-sol, prompt dsa-fxshare-report-pages-v3. Candidate page image sha256=903df6e5e2f6db8f0c564949f0b2903ff203c5a8c9afa1a7063f72ccb1ba2652.
Method: the calculation and evidence for St. Lucia
Calculation
From the chart’s 2024 position, foreign-currency debt is approximately 30 percent of GDP and the top of the stacked debt area is approximately 76 percent of GDP. Visible arithmetic implies an FX share near 30/76 × 100 ≈ 39.5 percent, but the direct-share field is left null because the plotted components are figure estimates rather than printed values.
Evidence
The upper chart is explicitly labeled “Debt by Currency (Percent of GDP)” and distinguishes Foreign currency, Local currency, and Local-linked debt.
The note directly below the currency chart states: “The perimeter shown is central government.”
The projection marker begins after the 2024 observation, so 2024 is the latest visibly historical actual year.
No visible note establishes inclusion of the central bank, guarantees, or nonguaranteed SOEs. Although “Local-linked” appears in the legend, the page does not explicitly state whether such debt is present in 2024.
How it was readBulk live read codex_cli/gpt-5.6-sol, prompt dsa-fxshare-report-pages-v3. Candidate page image sha256=f5b3ca2f49939bcfb092d66d56481aecb1450f678b4cec8b90c6ee9832f08a38.
Method: the calculation and evidence for St. Vincent and the Grenadines
Calculation
The same page reports total public debt of 87.1 percent of GDP at end-2023 and public sector external debt of 62.2 percent of GDP in 2023; visible arithmetic gives 62.2 / 87.1 × 100 = 71.4 percent, consistent with the reported rounded share of about 71.3 percent.
Evidence
PDF page 79 states that the share of external debt in total public debt was about 71.3 percent in 2023.
Footnote 2 explicitly says debt classification is based on residency, so the external-debt share is an FX proxy rather than a direct currency measure.
The coverage text states that public sector debt includes central government and SOE debt, that all SOE debt is guaranteed by the central government, and that there is no local government.
Text Table 1 marks central government and guarantees as covered, while central-bank borrowing and non-guaranteed SOE debt are not marked as covered.
How it was readBulk live read codex_cli/gpt-5.6-sol, prompt dsa-fxshare-report-pages-v3. Candidate page image sha256=f2f7f7acebf5ff06cba092a614015dfc8abb5270e527c94d15c85052c94d48a4.
Visible arithmetic: 239.4 / 273.0 x 100 = 87.692 percent, rounded to 87.7 percent.
Evidence
Evidence: PDF page 71, Table 2, identifies 2020 as the sole actual year and reports public-sector debt of 273.0 percent of GDP and external debt of 239.4 percent of GDP.
The same table labels external/domestic debt residency-based and says there is no material difference between the two criteria.
PDF page 70, Table 1, independently reports 2020 public and publicly guaranteed external debt of 239.4 percent of GDP on the same residency basis.
PDF page 64 says public-debt data are limited and exclude SOEs; it also reports a separate HIPC debt-reconciliation estimate of external PPG debt at 163 percent of GDP, which differs from the LIC DSA because of methodological and exchange-rate differences stated in footnote 3.
PDF page 68 and the Table 2 footnote state coverage as central, state, and local governments plus the central bank; the stress test treats SOE debt outside the baseline coverage.
The LIC DSA table reports 2020 public-sector debt of 273.0 percent of GDP and residency-based external debt of 239.4 percent of GDP. The resulting 87.7 percent share is an explicit proxy. The separate HIPC debt-reconciliation discussion uses different methodology and exchange rates and is not substituted for the LIC DSA observation.
Visible arithmetic: 77 percent of GDP foreign-exchange debt / 88 percent of GDP total public debt x 100 = 87.5 percent of total debt. Both numerator and denominator are directly stated for end-2024 in the same figure commentary and share the central-government DSA perimeter established on the preceding page.
Evidence
Evidence: PDF pages 4, 5, and 6 establish the Suriname report identity and distinguish selected central-government and external-debt indicators from the DSA currency carrier.
PDF pages 32 and 33 contain balance-of-payments and external-sector data; these are incompatible with the requested public-debt currency share and are not substituted.
Additional canonical PDF page 45, printed page 40, is Annex III Figure 2, Debt Coverage and Disclosures. It selects CG, includes only budgetary central government, excludes the central bank and public corporations, and states that Suriname's public debt in the DSA covers only central-government debt.
PDF page 46, printed page 41, is Annex III Figure 3a. Its top panel is directly labeled Debt by Currency and separates foreign from local currency. Its commentary directly states that end-2024 public debt was 88 percent of GDP and foreign-exchange debt was 77 percent of GDP.
PDF page 47 decomposes debt by creditor and reports external debt; it is not treated as equivalent to the direct currency measure. PDF page 57 is external-sector material and likewise is not substituted.
The report title, Suriname country label, MAC SRDSF annex, 2024 historical year, named currency carrier, central-government perimeter, and arithmetic are all visible in the hash-verified canonical source and page-pinned provenance.
The figure commentary directly reports end-2024 foreign-exchange debt and total public debt in percent of GDP. The immediately preceding DSA coverage page supplies the missing central-government perimeter. The value is direct currency evidence and does not use external debt, creditor location, governing law, or IDS as an equivalent measure.
Method: the calculation and evidence for Swaziland
Calculation
Visible arithmetic: No reconstruction is required: the source directly states foreign-currency debt as 44 percent of total debt for FY2024/25.
Evidence
Evidence: PDF pages 4, 8, and 11 establish the Kingdom of Eswatini report identity and context. ISO3 SWZ matches the queue's legacy Swaziland label.
PDF page 19, printed page 14, paragraph 24 directly states that the foreign-currency share rises from 44 percent of total debt in FY2024/25 to a projected 49 percent in FY2025/26. The reviewed observation is the non-projected FY2024/25 value.
PDF page 48, printed page 43, Figure 3 names the Debt by Currency carrier and states that all figures refer to budgetary central government; its top panel separates only foreign and local currency.
PDF page 57 discusses public-debt financing and external markets, while PDF page 65 is reserve-adequacy material; neither provides a later direct total-debt currency share.
No IDS statistic is used, and the external-debt commentary on PDF page 48 is not treated as equivalent to the direct foreign-currency share.
Paragraph 24 directly states the FY2024/25 foreign-currency share as 44 percent of total debt. Figure 3 supplies the named currency carrier and identifies the scope as budgetary central government. The queue's legacy country label Swaziland is identity-compatible with the report's current name, Eswatini, under ISO3 SWZ.
Visible arithmetic: 4 ÷ 31 × 100 ≈ 12.9 percent of total debt. This is a currency-based FX share, not a residency or governing-law proxy.
Evidence
The upper chart is explicitly labeled “Debt by Currency (Percent of GDP)” and separates “Foreign currency” from “Local currency.”
The coverage note directly below the chart states: “The perimeter shown is general government.”
The projection marker begins after the 2022 actual observation; therefore 2022 is the latest visibly historical year.
At 2022, the stacked chart visibly indicates foreign-currency debt of approximately 4 percent of GDP and total debt of approximately 31 percent of GDP.
How it was readBulk live read codex_cli/gpt-5.6-sol, prompt dsa-fxshare-report-pages-v3. Candidate page image sha256=13ac4cbb262ac1e041a0e6a6d286a8b35588c7175c14276e883891cf4a373c4f.
Method: the calculation and evidence for Tajikistan
Calculation
Visible arithmetic: 22.3 / 24.9 x 100 = 89.558 percent, rounded to 89.6 percent at the dataset's one-decimal precision.
Evidence
Evidence: PDF page 142, Table 2, reports 2024 public-sector debt of 24.9 percent of GDP and external debt of 22.3 percent of GDP, and labels the external/domestic definition residency-based.
PDF page 120 states that coverage includes central government debt and guarantees, the social security fund, extrabudgetary funds, central-bank borrowing on behalf of government, and excludes non-guaranteed SOE liabilities.
The coverage of social security and extrabudgetary funds on PDF page 120 requires a general-government base perimeter, correcting the model's central-government label.
PDF page 141 is the external DSA table and supports the residency definition. PDF pages 19, 86, 102, and 128 provide macroeconomic, program, and debt-management context but no competing direct currency share.
Table 2 reports the latest actual 2024 public-sector and external-debt GDP shares, supporting an 89.6 percent residency proxy. Coverage includes the social security fund and extrabudgetary funds, so the base perimeter is general government rather than central government.
Visible arithmetic: 24,600 / 37,321 x 100 = 65.915 percent, rounded to the table's directly reported 65.9 percent. The 32.9 / 49.9 GDP-component ratio also rounds to 65.9.
Evidence
Evidence: PDF page 125, Text Table 2, reports 2024 total debt of US$37,321 million and external debt of US$24,600 million, with the external share directly shown as 65.9 percent of total debt and 32.9 percent of GDP.
PDF page 124 states that external debt accounted for 66 percent of total debt at end-FY2023/24 and that DSA year 2024 corresponds to FY2023/24.
PDF page 123 defines coverage as central-government debt, central-government-guaranteed debt, and central-bank debt, explicitly excluding non-guaranteed SOE and local-government debt; it defines external debt by residency.
PDF pages 142 and 143 confirm the residency basis, 2024 total debt of 49.9 percent of GDP, external debt of 32.9 percent of GDP, and no material difference between criteria.
PDF page 111 contains reporting requirements and PDF page 44 is a selected-economic-indicators table; neither supplies a direct currency-denomination share.
Text Table 2 directly reports 2024 external debt at 65.9 percent of total debt. DSA year 2024 denotes FY2023/24. External debt is residency-based, so the value remains an explicit proxy.
This row carries no separate arithmetic clause. The derivation is described in the evidence below.
Evidence
Figure 3 explicitly labels the upper panel “Debt by Currency (Percent of GDP)” and separates Foreign currency, Local currency, and Local-linked debt.
The latest historical point before the projection segment is 2025. Visually, total NFPS debt is about 64.8 percent of GDP and the foreign-currency layer is about 0.5 percent of GDP; this would imply an FX share of roughly 0.5 / 64.8 × 100 ≈ 0.8 percent, but the direct-share field is left null because both inputs are figure estimates.
The panel note states: “The perimeter shown is nonfinancial public sector.”
Figure 2 on PDF page 65 identifies the selected DSA coverage as NFPS, includes budgetary central government, extra-budgetary funds, and public nonfinancial corporations, and excludes the central bank.
Figure 2’s commentary says public debt includes central-government debt, non-financial state-owned enterprises, government agencies, and guaranteed debt of Special Financial Institutions.
The legend explicitly includes a Local-linked category, so domestic_fx_linked_flag is y.
How it was readBulk live read codex_cli/gpt-5.6-sol, prompt dsa-fxshare-report-pages-v3. Candidate page image sha256=34d155a0e9484afac4141bac330fdb143dec5c99d567d7befda0ecca5cdc34da.
Method: the calculation and evidence for Timor-Leste
Calculation
Visible arithmetic: 13.9 / 13.9 × 100 = 100 percent of total debt.
Evidence
Table 2 on PDF page 73 reports 2020 actual public sector debt of 13.9 percent of GDP and the indented row 'of which: external debt' also at 13.9 percent of GDP.
The table explicitly labels the definition of external/domestic debt as 'Currency-based' and states there is no material difference between the two criteria; therefore the external-debt component is direct foreign-currency evidence rather than a residency proxy.
Table 2 footnote 1 states: 'Coverage of debt: The central government, government-guaranteed debt.' This establishes a central-government base perimeter with guarantees included.
Text Table 1 on PDF page 59 checks central government and guarantees, while central-bank debt and non-guaranteed SOE debt are not checked.
How it was readBulk live read codex_cli/gpt-5.6-sol, prompt dsa-fxshare-report-pages-v3. Candidate page image sha256=e32c342c3734cfa9ccf3128beda75d64034438ceee5d74052a8baa58aacf4b53.
Visible arithmetic: 30.4 ÷ 72.1 × 100 = 42.16 percent of total public debt.
Evidence
In Table 2, the latest historical column labeled “Actual” is 2024. The row “Public sector debt 1/” reports 72.1 percent of GDP, and its indented child row “of which: external debt” reports 30.4 percent of GDP.
The table explicitly labels the “Definition of external/domestic debt” as “Currency-based,” so the external-debt component is a direct foreign-currency measure rather than a residency proxy.
Footnote 1 defines coverage as “The central government plus social security, government-guaranteed debt, non-guaranteed SOE debt.” This supports a public-sector perimeter and inclusion of guarantees and non-guaranteed SOE debt.
Text Table 1 on PDF page 99 visibly marks central government, guarantees, and non-guaranteed SOE debt as covered, while the central bank row is not marked as covered.
How it was readBulk live read codex_cli/gpt-5.6-sol, prompt dsa-fxshare-report-pages-v3. Candidate page image sha256=1cc13ec21cc02047b935d860bfea7654715c5f11be8fe13f4fd7fbb828f429bb.
Visible arithmetic: 31.7 / 37.0 x 100 = 85.676 percent, rounded to 85.7 percent at the dataset's one-decimal precision.
Evidence
Evidence: PDF page 86, Table 2, reports FY2024 public-sector debt of 37.0 percent of GDP and external debt of 31.7 percent of GDP, and labels the external/domestic definition residency-based.
PDF page 73 states that baseline coverage is general government and central bank, that the DSA is conducted on a residency basis, and that guaranteed and non-guaranteed SOE debt are not included because of data limitations.
PDF page 73 also reports government-guaranteed debt outside the baseline and places it in the contingent-liability treatment, supporting no for baseline guarantee inclusion rather than treating the liability as observed debt.
PDF page 85, Table 1, independently reports FY2024 PPG external debt of 31.7 percent of GDP and labels the definition residency-based.
PDF pages 5, 16, 31, and 34 provide report, debt, and fiscal context but no compatible direct currency-denomination share.
Table 2 reports the latest actual FY2024 public-sector and external-debt GDP shares, supporting an 85.7 percent residency proxy. Baseline coverage is general government and central bank; guaranteed and non-guaranteed SOE debt are outside the baseline and addressed through the contingent-liability treatment.
Method: the calculation and evidence for Trinidad and Tobago
Calculation
Visible arithmetic: No reconstruction is required because 31 percent is already stated as foreign-currency debt divided by total central-government debt outstanding. As a consistency check only, 31 percent of the reported 67.8 percent-of-GDP total is about 21.0 percent of GDP.
Evidence
Evidence: PDF page 54 (printed page 50), Annex III paragraph 2, directly states that only 31 percent of central-government debt outstanding is denominated in foreign currency.
The same page reports total central-government debt of 67.8 percent of GDP in FY2025 and defines the perimeter as central government only. It explicitly excludes short-term monetary-policy-linked debt of about 0.5 percent of GDP.
PDF page 60 selects central-government baseline coverage and excludes the central bank, public nonfinancial corporations, guaranteed debt, and self-serviced non-guaranteed SOE debt from the baseline. It reports the latter two only as contingent liabilities outside the selected stock.
PDF page 61 independently displays a central-government Debt by Currency panel with foreign- and local-currency categories. PDF page 44 reports external debt and was not substituted for currency denomination; PDF pages 4 and 6 provide debt-total and contents context.
Directly stated FY2025 foreign-currency share of central-government debt outstanding. The selected DSA coverage excludes the central bank, guarantees, and non-guaranteed SOE debt from the baseline; no external-debt proxy or reconstructed numerator is used, and no gate was changed.
Visible arithmetic: 12.0 / 23.6 × 100 = 50.8 percent of total debt.
Evidence
The upper chart is directly labeled “Debt by Currency (Percent of GDP)” and separates “Foreign currency,” “Local currency,” and “Local-linked” debt.
The chart’s note explicitly states: “The perimeter shown is general government.”
The latest historical point is 2024, immediately before the projection period; the visible foreign-currency component is approximately 12.0 percent of GDP and total debt is approximately 23.6 percent of GDP.
The observation is a figure estimate, so the extracted component and resulting share are approximate.
How it was readBulk live read codex_cli/gpt-5.6-sol, prompt dsa-fxshare-report-pages-v3. Candidate page image sha256=3bd64547be0e1e12245078a867a96ddb6c8d75a18846e2d4d79857cb2068c663.
Visible arithmetic: 6.9 / 10.1 x 100 = 68.317 percent, rounded to 68.3 percent.
Evidence
Evidence: PDF page 69, Table 1, reports 2022 external debt of 6.9 percent of GDP, all of it public and publicly guaranteed, and labels the external/domestic definition residency-based with a material difference between criteria.
PDF page 54 states that total public debt was 10.1 percent of GDP at end-2022.
PDF page 53 states that the baseline includes central-government debt plus government-guaranteed and non-guaranteed SOE debt, and that Tuvalu has no central bank.
The page-53 coverage matrix marks central government, guarantees, and non-guaranteed SOE debt as covered; page 54 repeats that perimeter in the contingent-liability table.
PDF page 29 is a medium-term macroeconomic baseline table and PDF page 60 concerns debt thresholds and stress tests; neither provides a competing currency-share observation.
The 2022 DSA reports residency-based external PPG debt of 6.9 percent of GDP and total public debt of 10.1 percent of GDP, yielding 68.3 percent. Because government-guaranteed and non-guaranteed SOE debt are explicitly included in the baseline, the perimeter is public sector.
Visible arithmetic: 14,895.3 / 25,292.9 x 100 = 58.891 percent, rounded to the table's directly reported 58.9 percent. The 29.9 / 50.7 rounded GDP-component ratio produces 59.0 and is not preferred over the direct stock share.
Evidence
Evidence: PDF page 88, Table 1, reports FY2022/23 end-period total debt of US$25,292.9 million and external debt of US$14,895.3 million, with external debt directly shown as 58.9 percent of total debt and 29.9 percent of GDP.
PDF page 87 reports the same 29.9 percent external and 20.8 percent domestic GDP components and notes that local-currency government securities held by offshore investors equal 4 percent of external public debt.
PDF page 86 defines the external/domestic basis as residency and coverage as central and local government, guarantees, and central-bank borrowing; it explicitly excludes non-guaranteed SOE debt.
PDF page 107 confirms FY2022/23 as the actual period, total debt of 50.7 percent of GDP, external debt of 29.9 percent of GDP, and a material difference between residency and currency criteria.
PDF page 42 concerns external-sector developments, PDF page 89 decomposes external creditors, and PDF page 98 discusses stress tests; none provides a direct currency-denomination share.
Table 1 directly reports FY2022/23 external debt at 58.9 percent of total debt. The DSA definition is residency-based and includes local-currency government securities held by nonresidents, so 58.9 percent is only a proxy.
Visible arithmetic: approximately 66.5 / 89.7 × 100 = 74.1 percent of total general-government debt.
Evidence
PDF page 103 (printed page 98) directly labels the upper panel “Debt by Currency (Percent of GDP)” and separates Foreign currency, Local currency, and Local-linked debt.
The note immediately beneath the currency figure states: “The perimeter shown is general government.”
The projection marker begins after the 2024 observation, making 2024 the latest visible historical actual year.
The 2024 foreign-currency area is approximately 66.5 percent of GDP from the plotted scale. The report states that the end-December 2024 public-debt level used in the SRDSA is 89.7 percent of GDP.
Because the numerator is estimated from a figure rather than printed as an exact data value, the result is approximate and confidence is capped below high.
How it was readBulk live read codex_cli/gpt-5.6-sol, prompt dsa-fxshare-report-pages-v3. Candidate page image sha256=5a5a657d7da20c572165585601bd20599afbf50392b6dfd148e7ee449ece2d3e.
Method: the calculation and evidence for United Arab Emirates
Calculation
Visible arithmetic: approximately 19.5 / 34.9 × 100 = 55.9 percent, rounded to 56.0 percent of total debt.
Evidence
PDF page 42 (printed page 37) directly labels the upper chart “Debt by Currency (percent of GDP)” and identifies the light-blue component as “Foreign currency.”
The chart explicitly notes: “The perimeter shown is general government.”
The latest historical point is 2024; the visible projection marker begins after 2024, so 2024 is treated as actual.
The 2024 foreign-currency component is approximately 19.5 percent of GDP from the plotted boundary. PDF page 32 reports exact 2024 gross general government debt of 34.9 percent of GDP.
This is a currency-based observation, not a residency- or governing-law-based proxy.
How it was readBulk live read codex_cli/gpt-5.6-sol, prompt dsa-fxshare-report-pages-v3. Candidate page image sha256=bdfa844314499f084eabc87df54ac0f2053717b0d820fa7881e96ab2fb4f3a35.
Method: the calculation and evidence for United Kingdom
Calculation
This row carries no separate arithmetic clause. The derivation is described in the evidence below.
Evidence
The top panel is explicitly labeled “Debt by Currency (Percent of GDP)” and its legend distinguishes Foreign currency, Local currency, and Local-linked debt.
The note directly below the currency panel states: “The perimeter shown is general government.”
The commentary states: “Debt is entirely in domestic currency,” which implies foreign-currency debt is 0 percent of total debt (100% domestic, so 100 − 100 = 0%).
The projection marker begins after the 2025 observation; therefore 2025 is the latest visible historical actual year.
No exact GDP-denominated foreign-currency or total-debt values are printed, so those component fields are not reported.
How it was readBulk live read codex_cli/gpt-5.6-sol, prompt dsa-fxshare-report-pages-v3. Candidate page image sha256=6a8fe2ab39aa0f15b1eee716a3b8230ee7f417f2c17a26ffffc1e1c1cef45d66.
Method: the calculation and evidence for United States
Calculation
Visible arithmetic: At 2024, foreign-currency debt is exactly 0.0 percent of GDP and the general-government currency-chart total is positive; 100 x 0.0 / positive total = 0.0 percent of total debt.
Evidence
Evidence: PDF page 63 (printed page 57) explicitly labels the selected carrier Debt by Currency and states that its perimeter is general government.
At the 2024 actual point, the canonical vector chart has a positive local-currency stack while the foreign-currency and local-linked paths remain at zero. The projection marker begins after 2024.
PDF page 62 selects general-government coverage and visibly includes the central bank and public nonfinancial corporations in the baseline; guarantees are not established by the visible fields.
PDF page 58 is a domestic-risk matrix and PDF page 71 is a surveillance-data table. Neither supplies a competing currency-denomination measure.
Manual source adjudication of an automatic invalid-arithmetic abstention. The canonical vector carrier proves exact zero foreign-currency and local-linked layers at the 2024 actual point while total debt remains positive. The zero is recorded with a +/-0.1 percentage-point figure tolerance; confidence remains medium under schema v0's figure-read cap, and no gate was changed.
Evidence limitation, disclosed: the report's text does not state the currency of issuance anywhere, so this zero rests on the chart evidence described above. The 2026-07-29 second-model verification pass rendered every page this row cites and, under the rule that a stated zero needs an explicit source statement, scored the row not confirmable; no evidence in any pass contradicted the value.
Visible arithmetic: 31.4 / 68.7 × 100 = 45.7 percent of total debt.
Evidence
PDF page 69 (printed page 63), Table 3, directly labels the upper chart “Debt by Currency (Percent of GDP)” and separates “Foreign currency,” “Local currency,” and “Local-linked” debt.
The figure’s coverage note states: “The perimeter shown is nonfinancial public sector,” establishing debt_perimeter=nfps.
The latest historical point is 2024; the projection segment begins after it. The foreign-currency area at 2024 is visibly about 31.4 percent of GDP, while total gross NFPS debt for 2024 is 68.7 percent of GDP in the selected-indicators table on PDF pages 6 and 38.
This is a direct currency classification, not a residency- or governing-law proxy. The separate governing-law pie chart is not used.
How it was readBulk live read codex_cli/gpt-5.6-sol, prompt dsa-fxshare-report-pages-v3. Candidate page image sha256=2e9ea7332b7bbd4b6767542015bec33571b6e793dfe21789c157cbc3d7268e74.
Method: the calculation and evidence for Uzbekistan
Calculation
This row carries no separate arithmetic clause. The derivation is described in the evidence below.
Evidence
PDF page 105, Table 2 shows 2025 under Actual: “Public sector debt” = 28.6 percent of GDP and the subordinate “of which: external debt” row = 25.9 percent of GDP.
The table hierarchy makes 28.6 the denominator for the subordinate external-debt amount: 25.9 / 28.6 × 100 = 90.56 percent of total debt.
Footnote 1 states: “Coverage of debt: The general government, central bank, government-guaranteed debt. Definition of external debt is Currency-based.” This establishes a general-government base perimeter, inclusion of the central bank and guarantees, and permits the external-debt share to be treated directly as an FX share rather than a proxy.
PDF page 92 states that PPG debt excludes non-guaranteed debt of SOEs.
How it was readBulk live read codex_cli/gpt-5.6-sol, prompt dsa-fxshare-report-pages-v3. Candidate page image sha256=968fc375964f04e81caf85fd107303c3878a0579b7c536c82175d2893591615a.
Visible arithmetic: The source directly states around 70 percent external and 30 percent domestic bonds and guarantees; 70 + 30 = 100 percent.
Evidence
Evidence: PDF page 50, Annex VI paragraph 1, states that outstanding debt was nearly VUT60 billion, 44 percent of GDP, in 2024 and that external debt comprised around 70 percent of total debt, with domestic bonds and guarantees making up the remaining 30 percent.
PDF page 71 defines coverage as central government, central-government-guaranteed debt, and central-bank debt borrowed on behalf of government, and defines external debt by residency.
The page-71 coverage matrix leaves non-guaranteed SOE debt outside the baseline; Air Vanuatu liabilities are treated as public debt after the airline became wholly government-owned, while other SOE debt is handled through the contingent-liability scenario.
PDF page 31 corroborates 2024 public and publicly guaranteed debt around 44 percent of GDP. Pages 33 and 35 are budget and balance-of-payments tables, and pages 7 and 8 are report overview pages; none supplies a direct currency share.
The source states that external debt comprised around 70 percent of total debt at end-2024. The DSA defines external debt by residency, so this approximate statement is retained only as a proxy.
Visible arithmetic: 12.0 / 35.0 × 100 = 34.3 percent of total debt.
Evidence
PDF page 75 (printed page 70), Figure 3 is explicitly titled “Debt by currency (percent of GDP).”
The figure note explicitly states: “The perimeter shown is general government.”
The latest historical point before the visibly marked projection period is 2022.
At 2022, the stacked chart visibly indicates approximately 12 percent of GDP in foreign-currency debt and approximately 35 percent of GDP in total debt.
The legend separately identifies Foreign currency, Local currency, and Local-linked debt, establishing a currency basis rather than residency or governing law. Local-linked debt is therefore explicitly represented in the figure.
How it was readBulk live read codex_cli/gpt-5.6-sol, prompt dsa-fxshare-report-pages-v3. Candidate page image sha256=6bd84f9f012ccfbc067be2ddea0eb987460c20361c22285e614485f65ec04287.
Visible arithmetic confirms the direct share: 79.5 / 127.8 × 100 ≈ 62.2 percent.
Evidence
The end-2024 table reports Total debt as 100.0 percent of total debt and 127.8 percent of GDP.
The child row “External Foreign-Currency Debt” reports 62.2 percent of total debt and 79.5 percent of GDP for 2024.
Footnote 2 states that coverage includes direct debt to central government, SOE-guaranteed debt, and non-guaranteed debt of ZESCO; this supports a public-sector perimeter with guarantees and non-guaranteed SOE debt included.
The measure is explicitly foreign-currency debt, so the definition basis is currency and the observation is not a proxy.
How it was readBulk live read codex_cli/gpt-5.6-sol, prompt dsa-fxshare-report-pages-v3. Candidate page image sha256=6bee782fe4cc1994d34d361a7c275b6d53c3eba5876a301ac814cf9dbd5fd1b4.
Visible arithmetic: 106.6 / 109.7 x 100 = 97.174 percent, rounded to 97.2 percent.
Evidence
Evidence: PDF page 110, Table 2, identifies 2018–2020 as actual and reports 2020 public-sector debt of 109.7 percent of GDP and external debt of 106.6 percent of GDP.
The same table labels external/domestic debt residency-based, says the criteria differ materially, and defines coverage as central government, central bank, government-guaranteed debt, and non-guaranteed SOE debt.
PDF page 101 states that public-debt coverage includes central-government, central-bank, and some SOE obligations; it also describes incomplete SOE domestic-debt coverage and the related contingent-liability stress test.
PDF page 109 independently confirms the residency basis for external debt. PDF page 106 discusses debt-sustainability risks, and PDF page 78 concerns external assets and liabilities; neither provides a direct currency-denomination share.
The 2020 DSA reports public-sector debt of 109.7 percent of GDP and residency-based external debt of 106.6 percent of GDP, yielding 97.2 percent. The source states that residency and currency criteria differ materially, so the value is only a proxy.
No country matches that filter.
Source: Teal Insights, dsa-fx-share v0.1.5. Values read from published IMF staff reports. CC BY 4.0. 18 of the 167 rows carry no separate arithmetic clause, because the report printed the share directly or the derivation sits in the evidence, and each says so when opened.
Check one value in about a minute
Choose the country row.
Open the linked report.
Go to the pinned PDF page and table or figure.
Read the definition, perimeter, proxy, and confidence fields.
Use the default, or replace it with better country evidence.
This is a maintained starting point, not a one-time claim of perfection. Source-backed corrections are welcome under the corrections policy. Good and runnable beats perfect and not done.
What would it take for you to trust it?
We mean that as a question. Break it: pick countries you know cold, and whatever does not reproduce from its cited page, we fix and re-audit in the open. Tell us where the bar is: which mix of deterministic checks, second reads, and named-human review would make this usable for your teams, and for which uses. And point the recipe: the same loop extends to the other inputs that live only inside reports, for the framework owners and for the country debt offices whose reports feed them. Write to lte@tealinsights.com. The bigger point is shared infrastructure, philanthropically funded and open source, so the field stops rebuilding this number alone. Policymakers and the people who advise them get to the hard policy questions instead of the toil in front of them.
Release
Get the data, methods, and caveats
Version 0.1.5 contains 167 rows and 25 fields. The dataset, metadata, and documentation are licensed under CC BY 4.0. Release-check code is licensed under MIT.